VFD Check Valve vs Standard Check Valve Flow Coefficient Testing
Download PDF >

INTRODUCTION

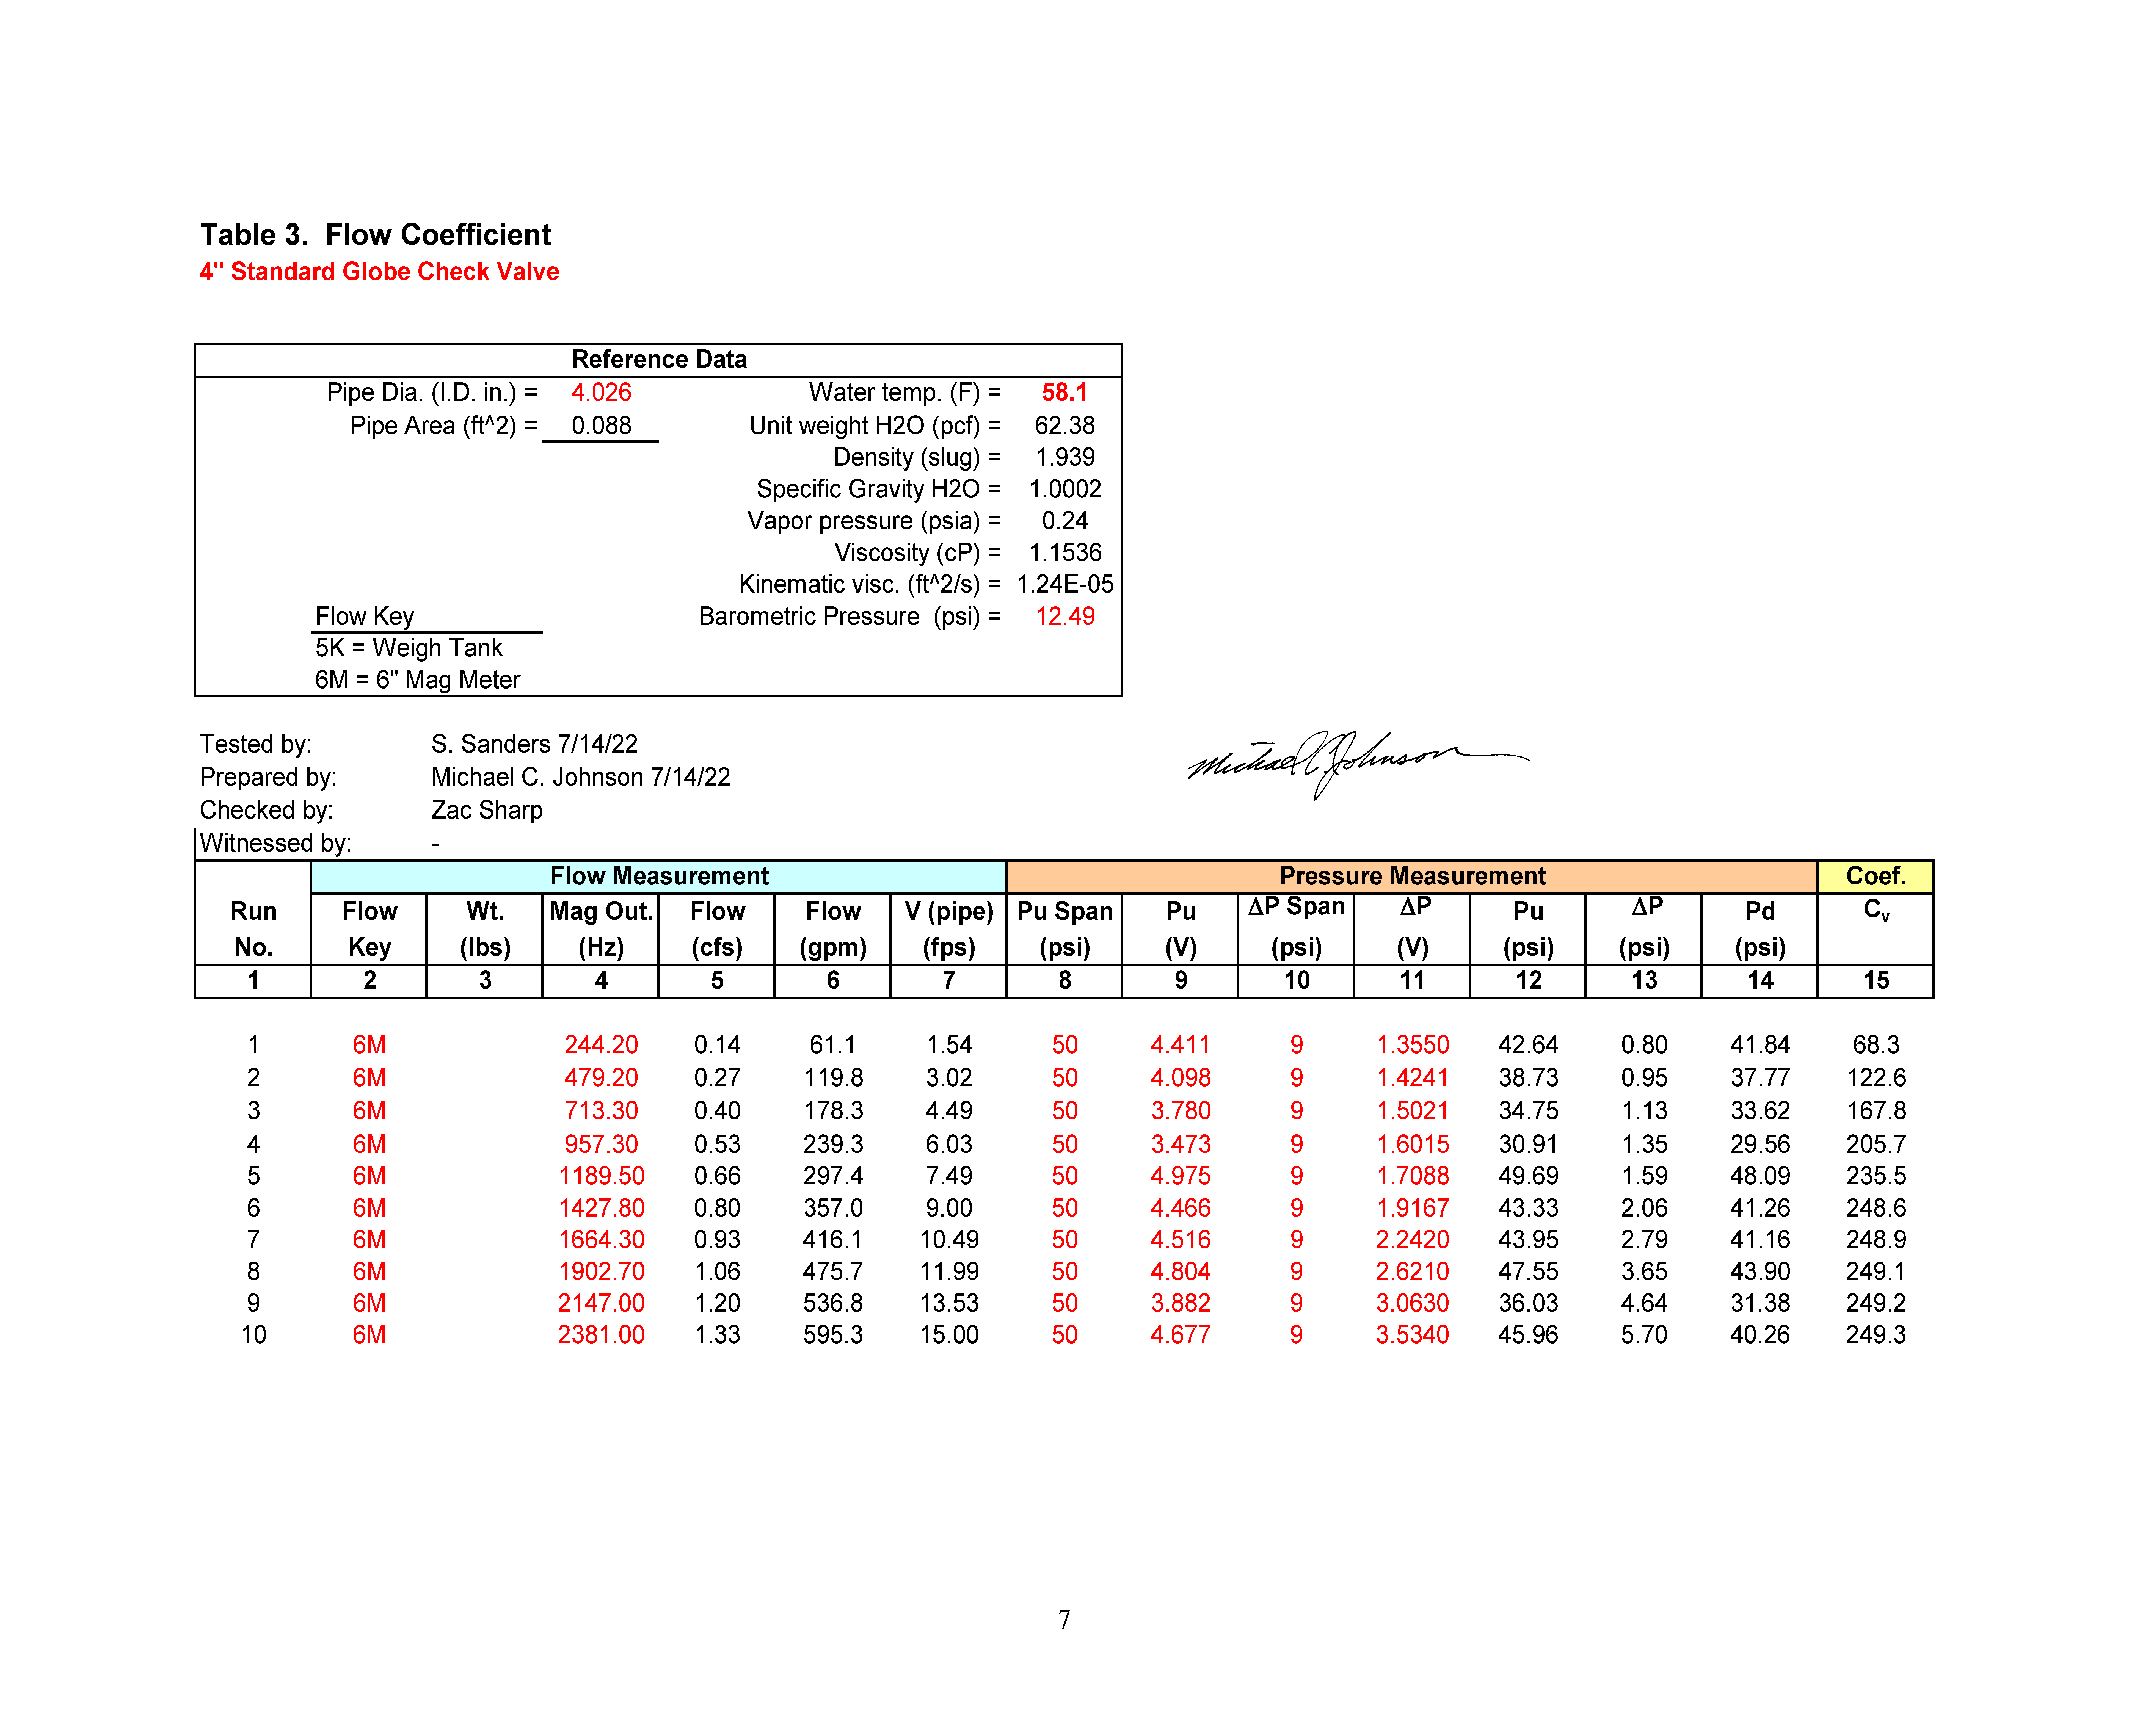
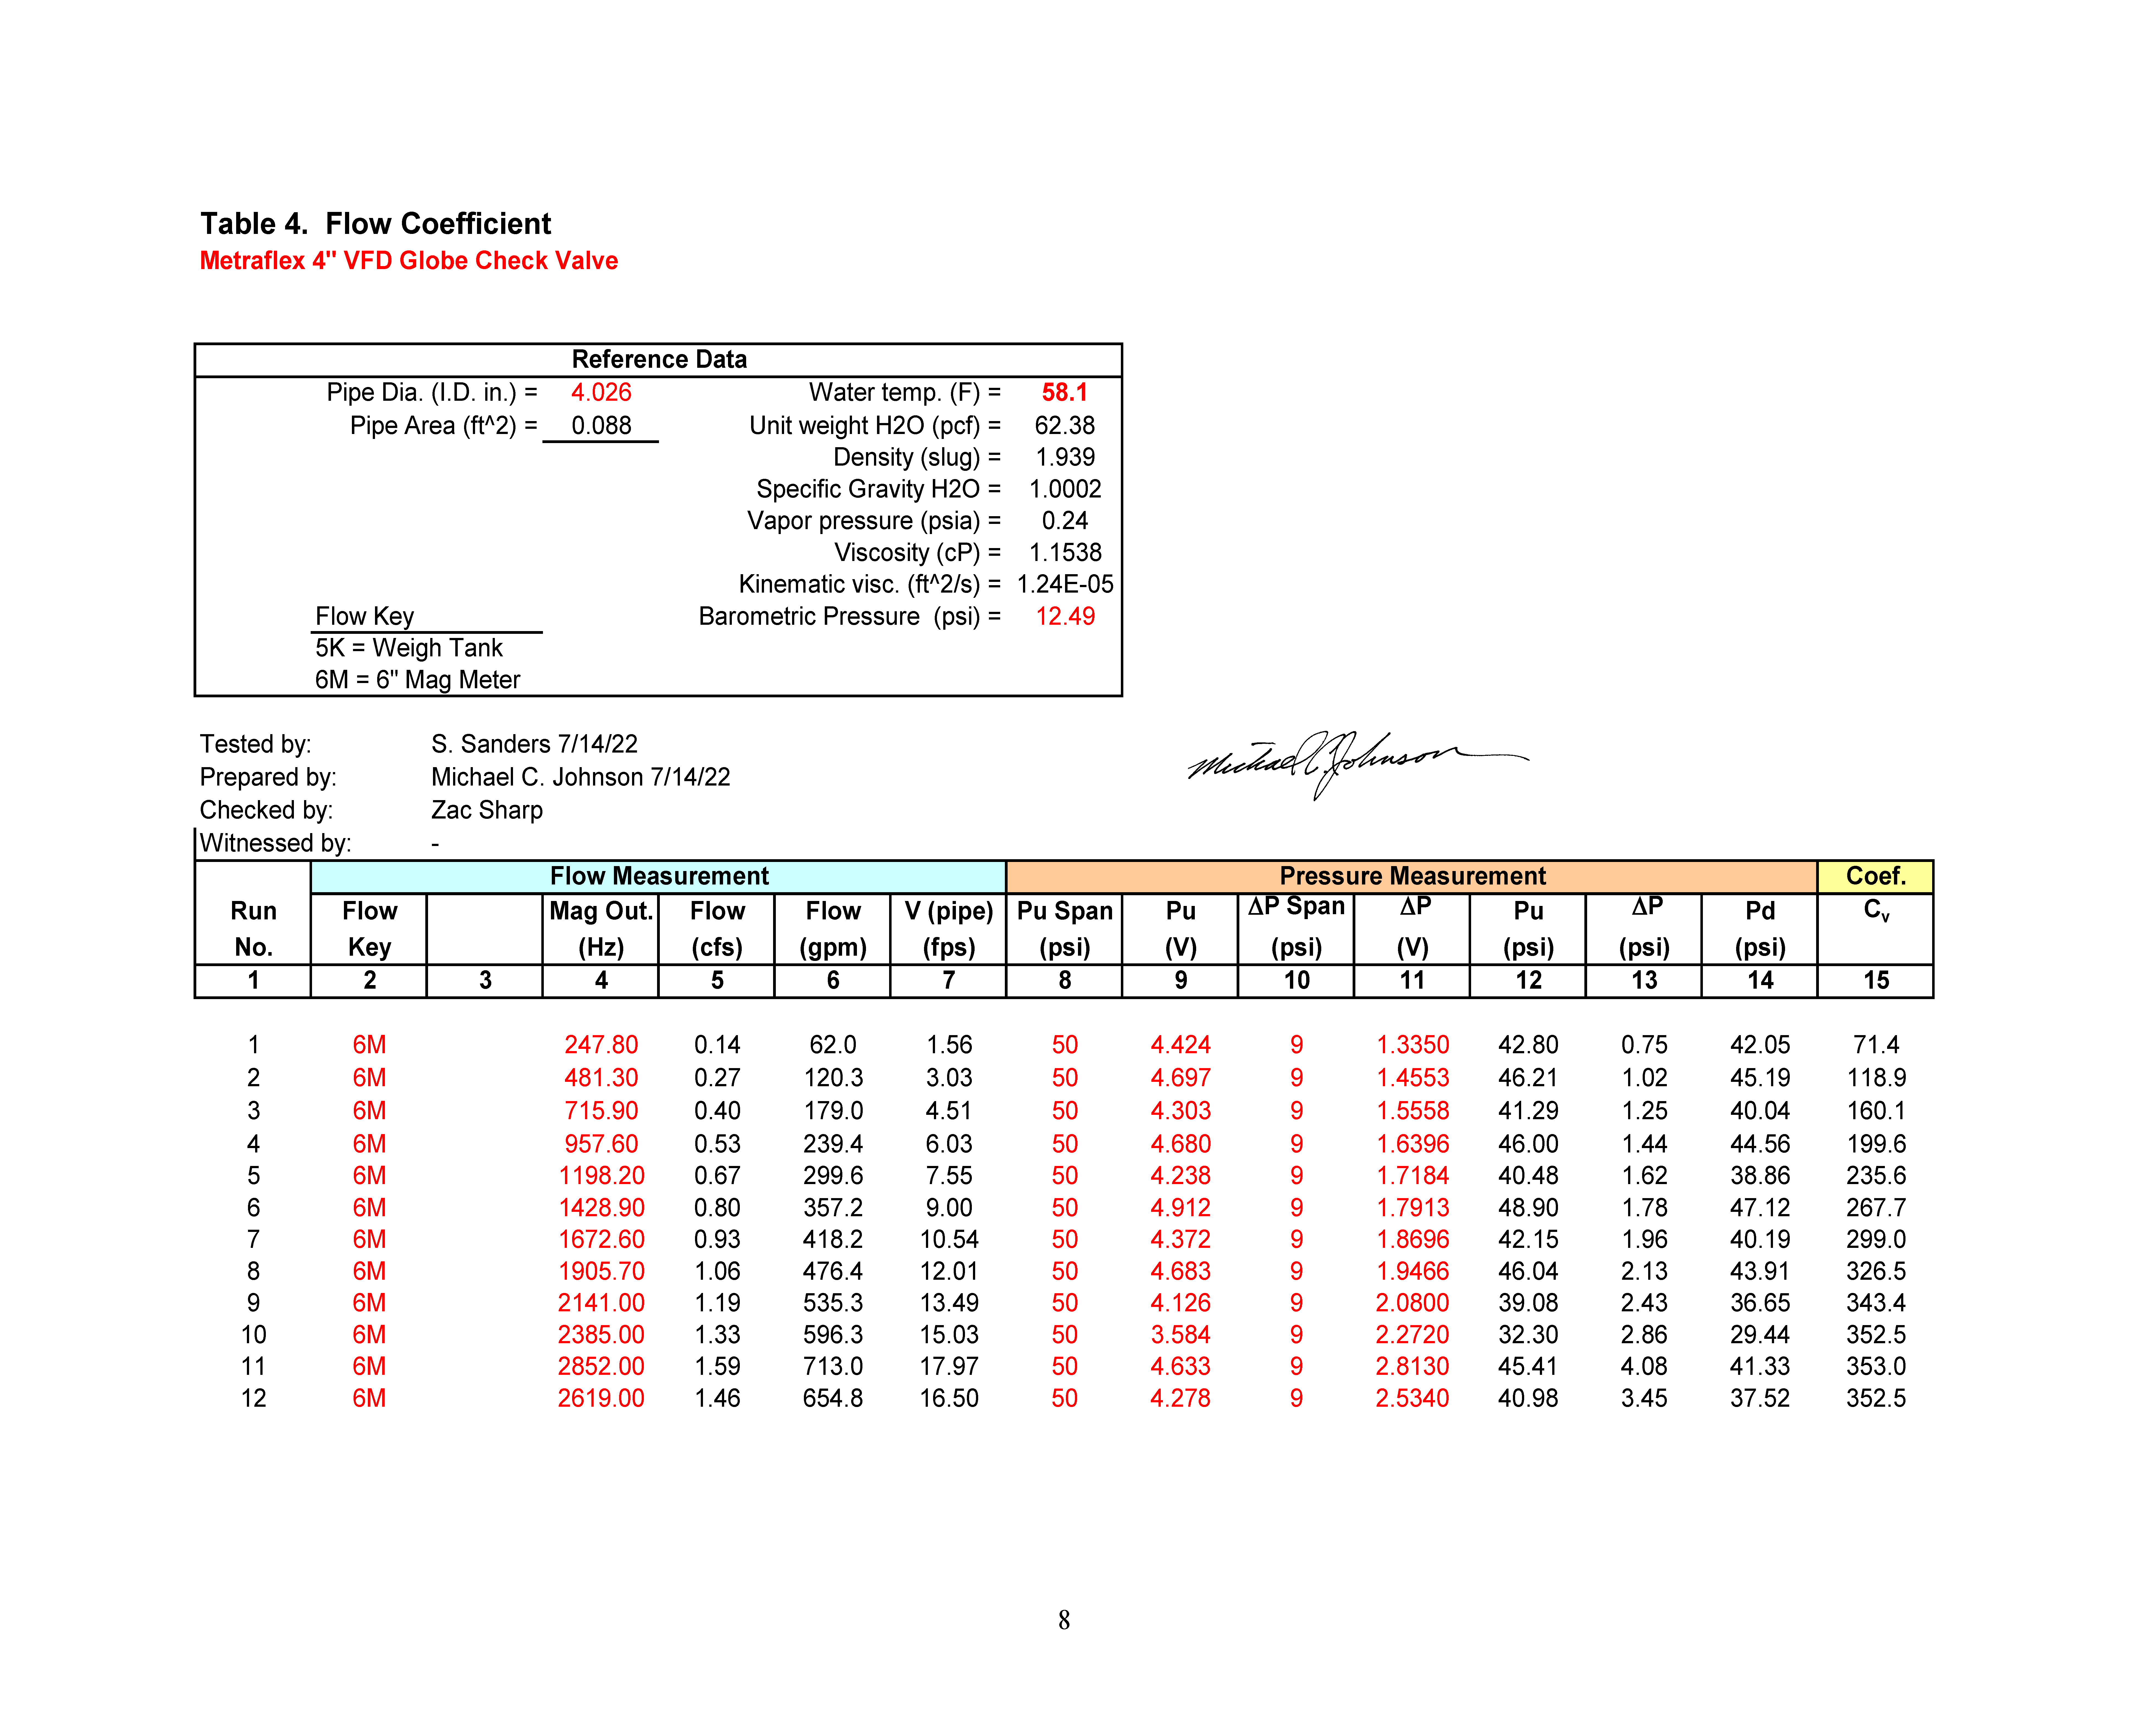
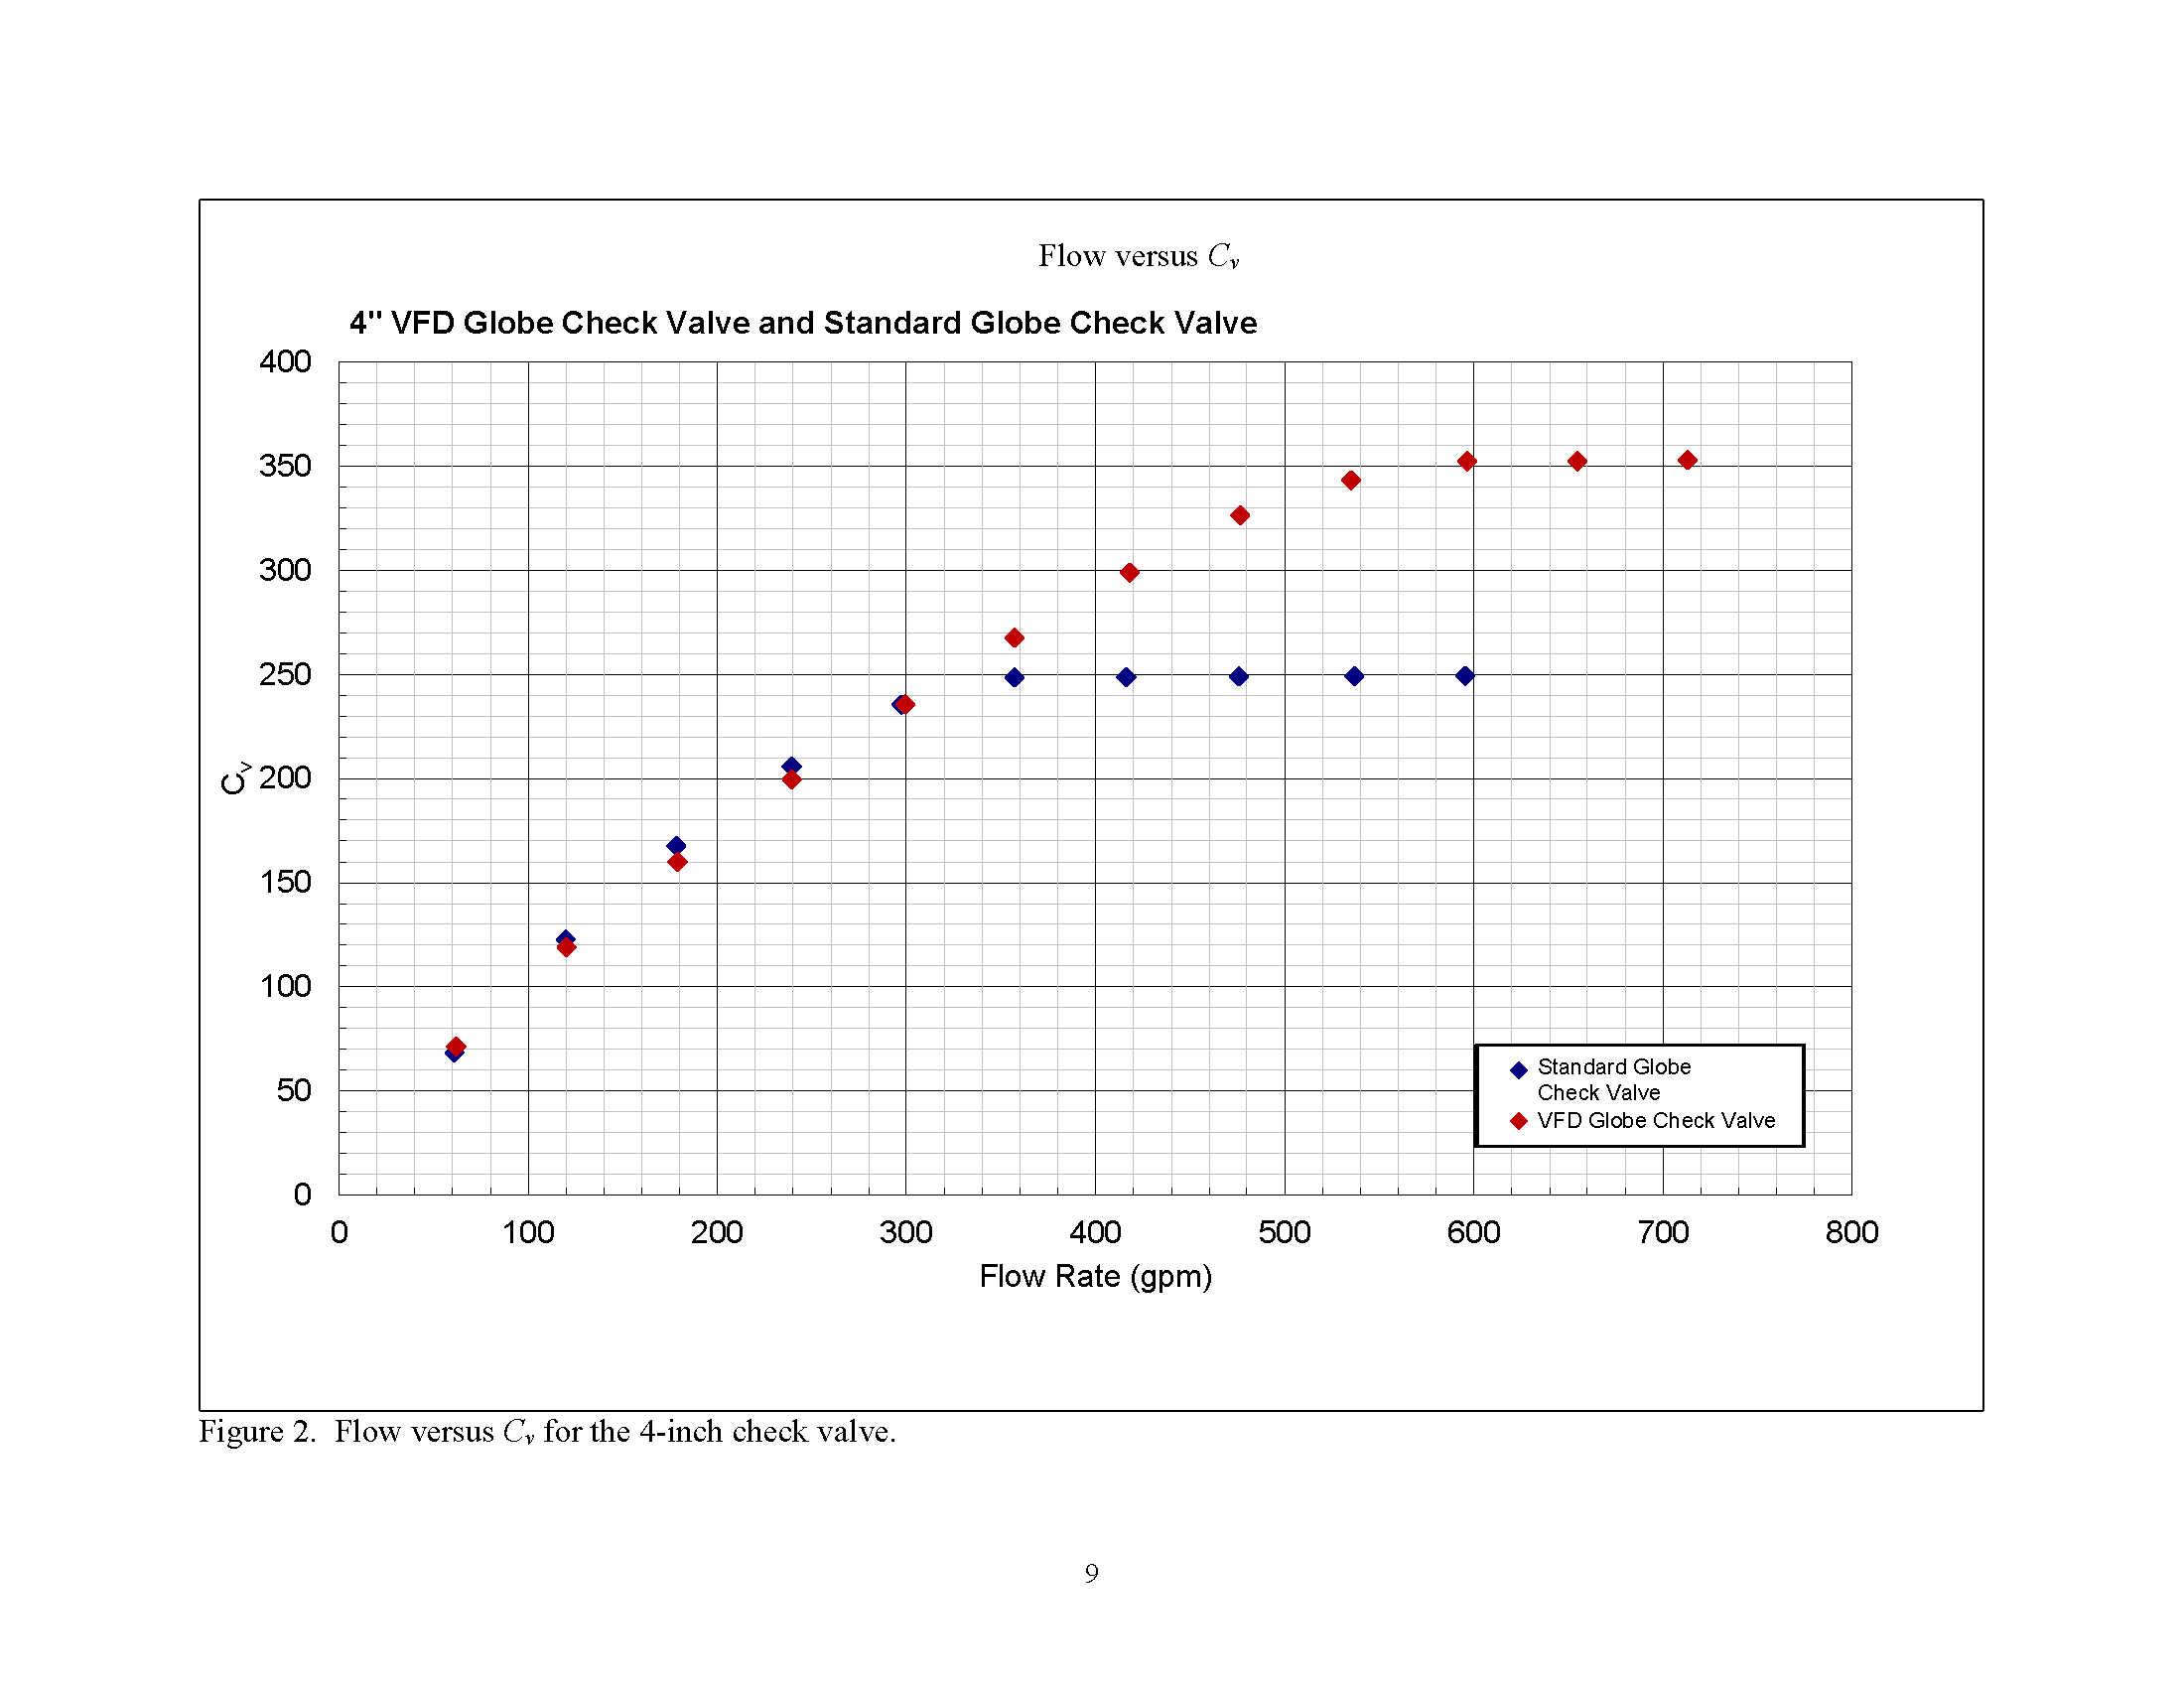
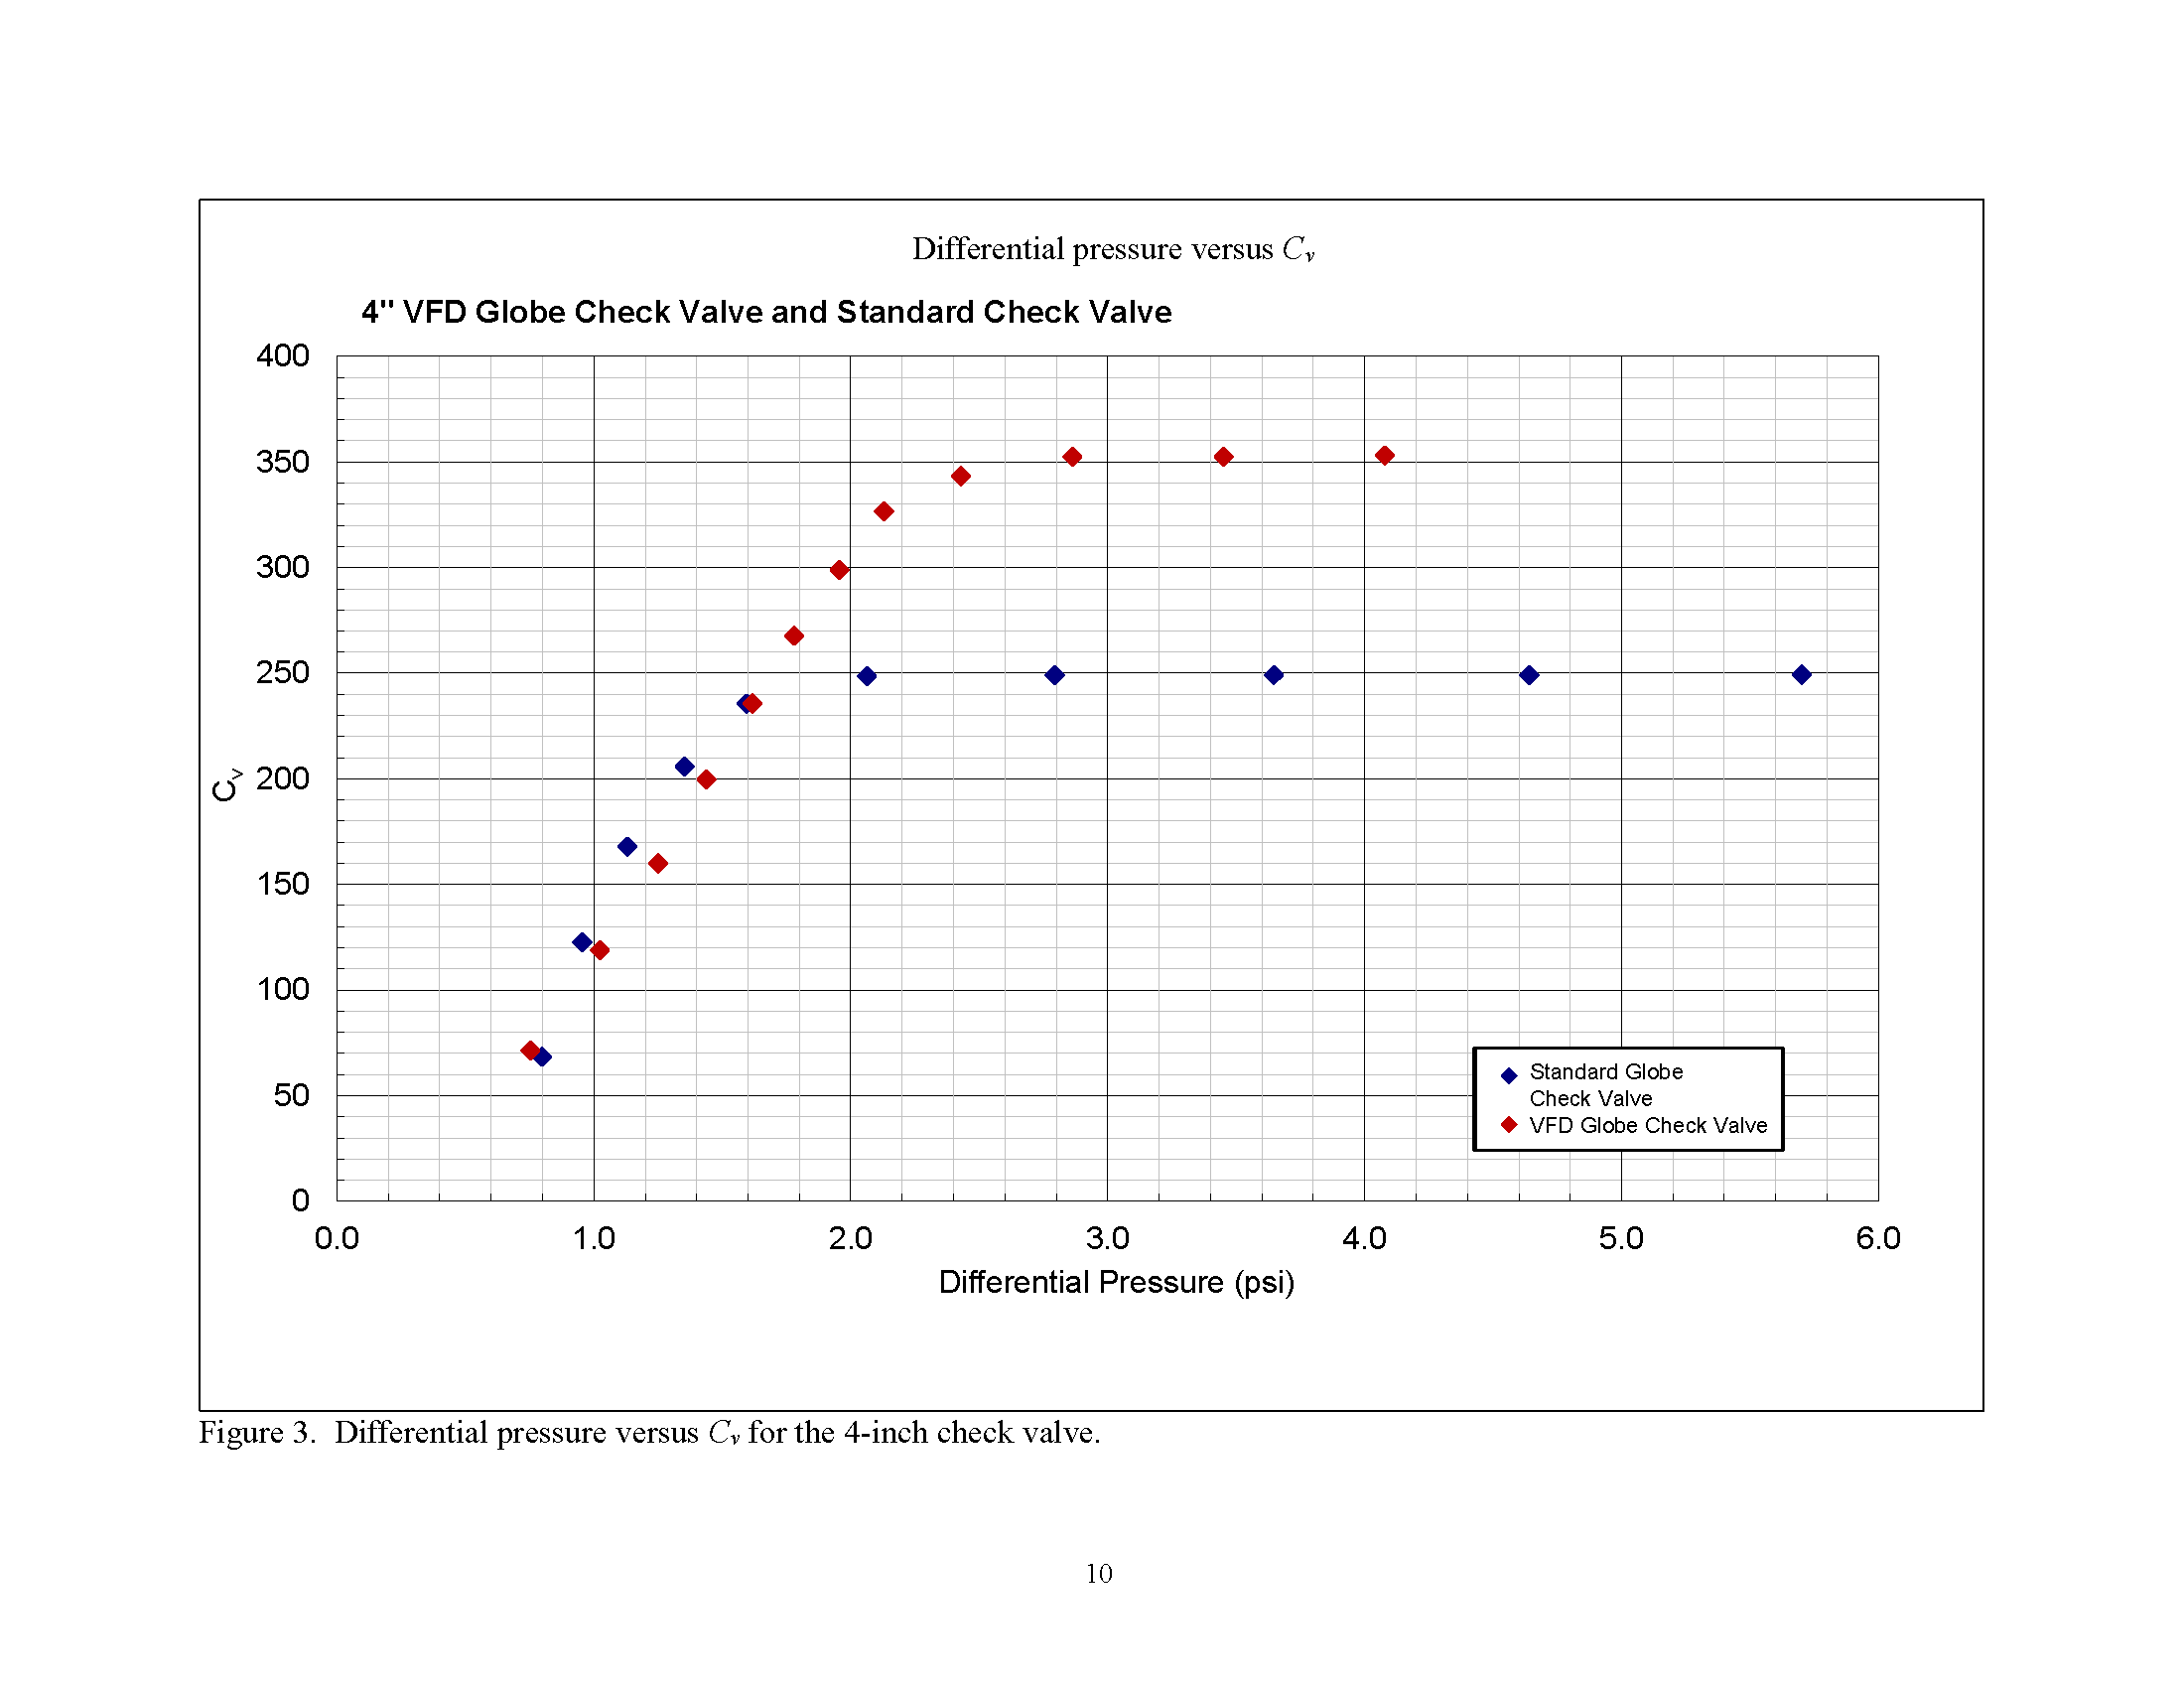
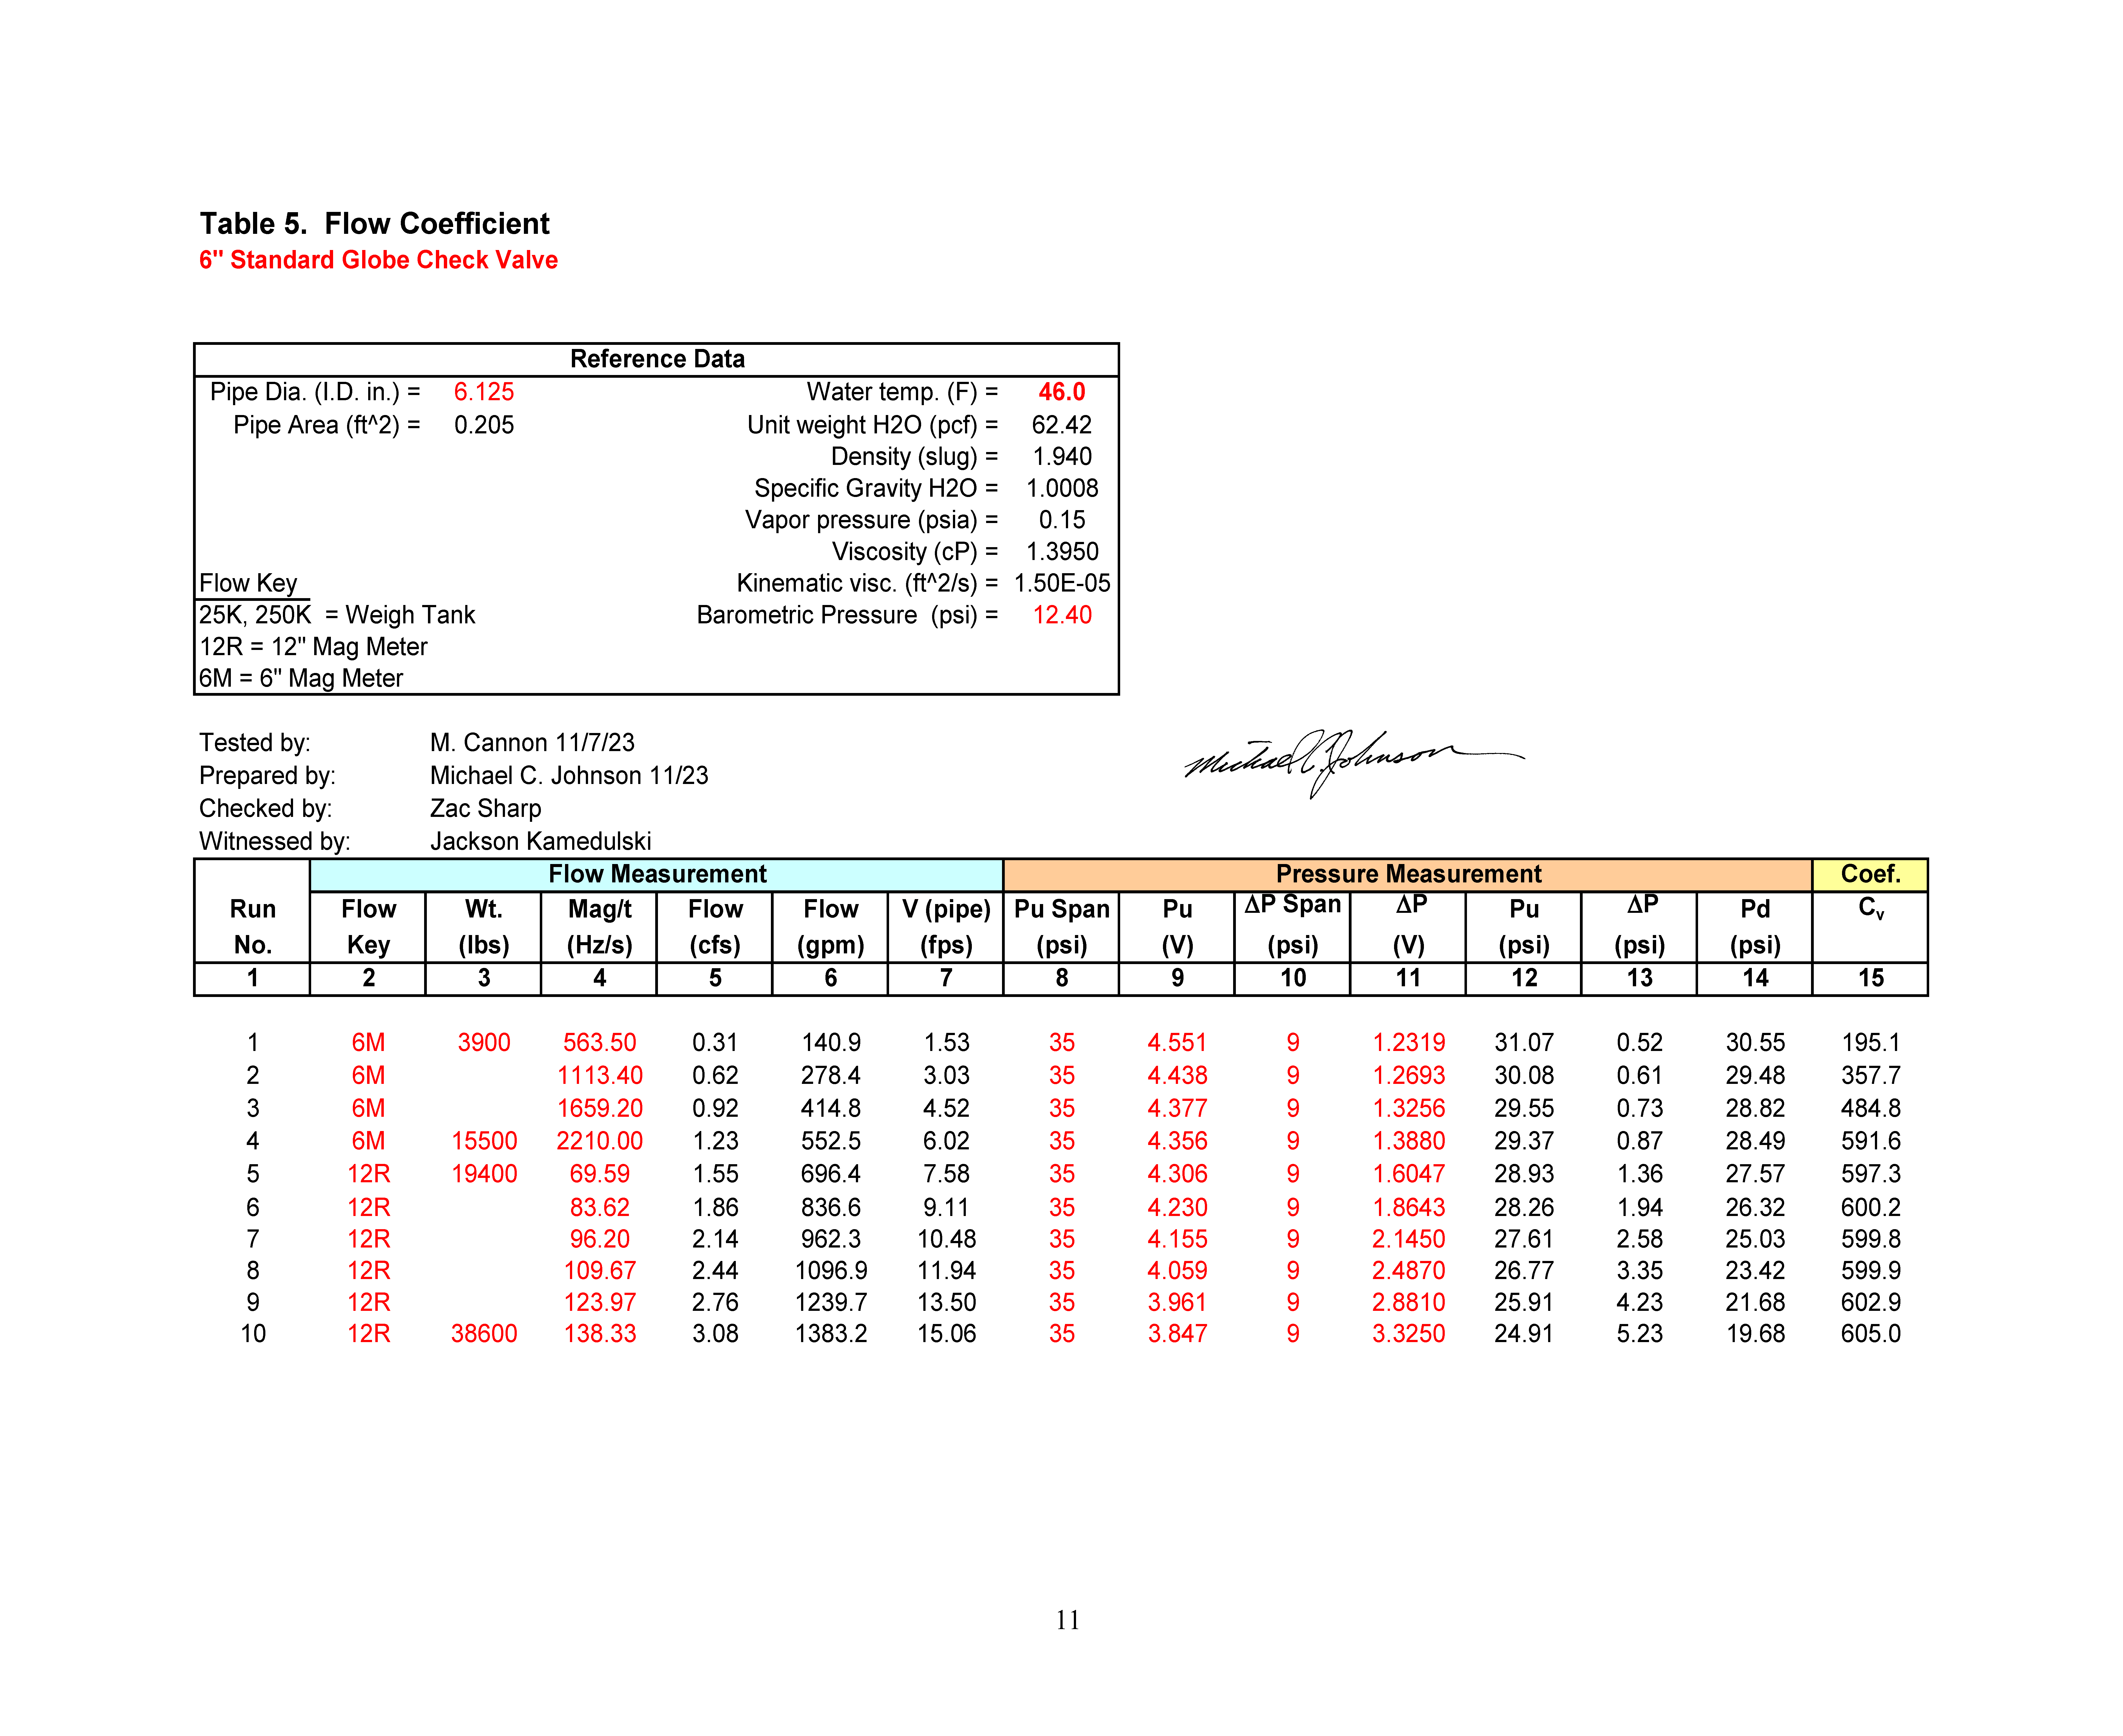
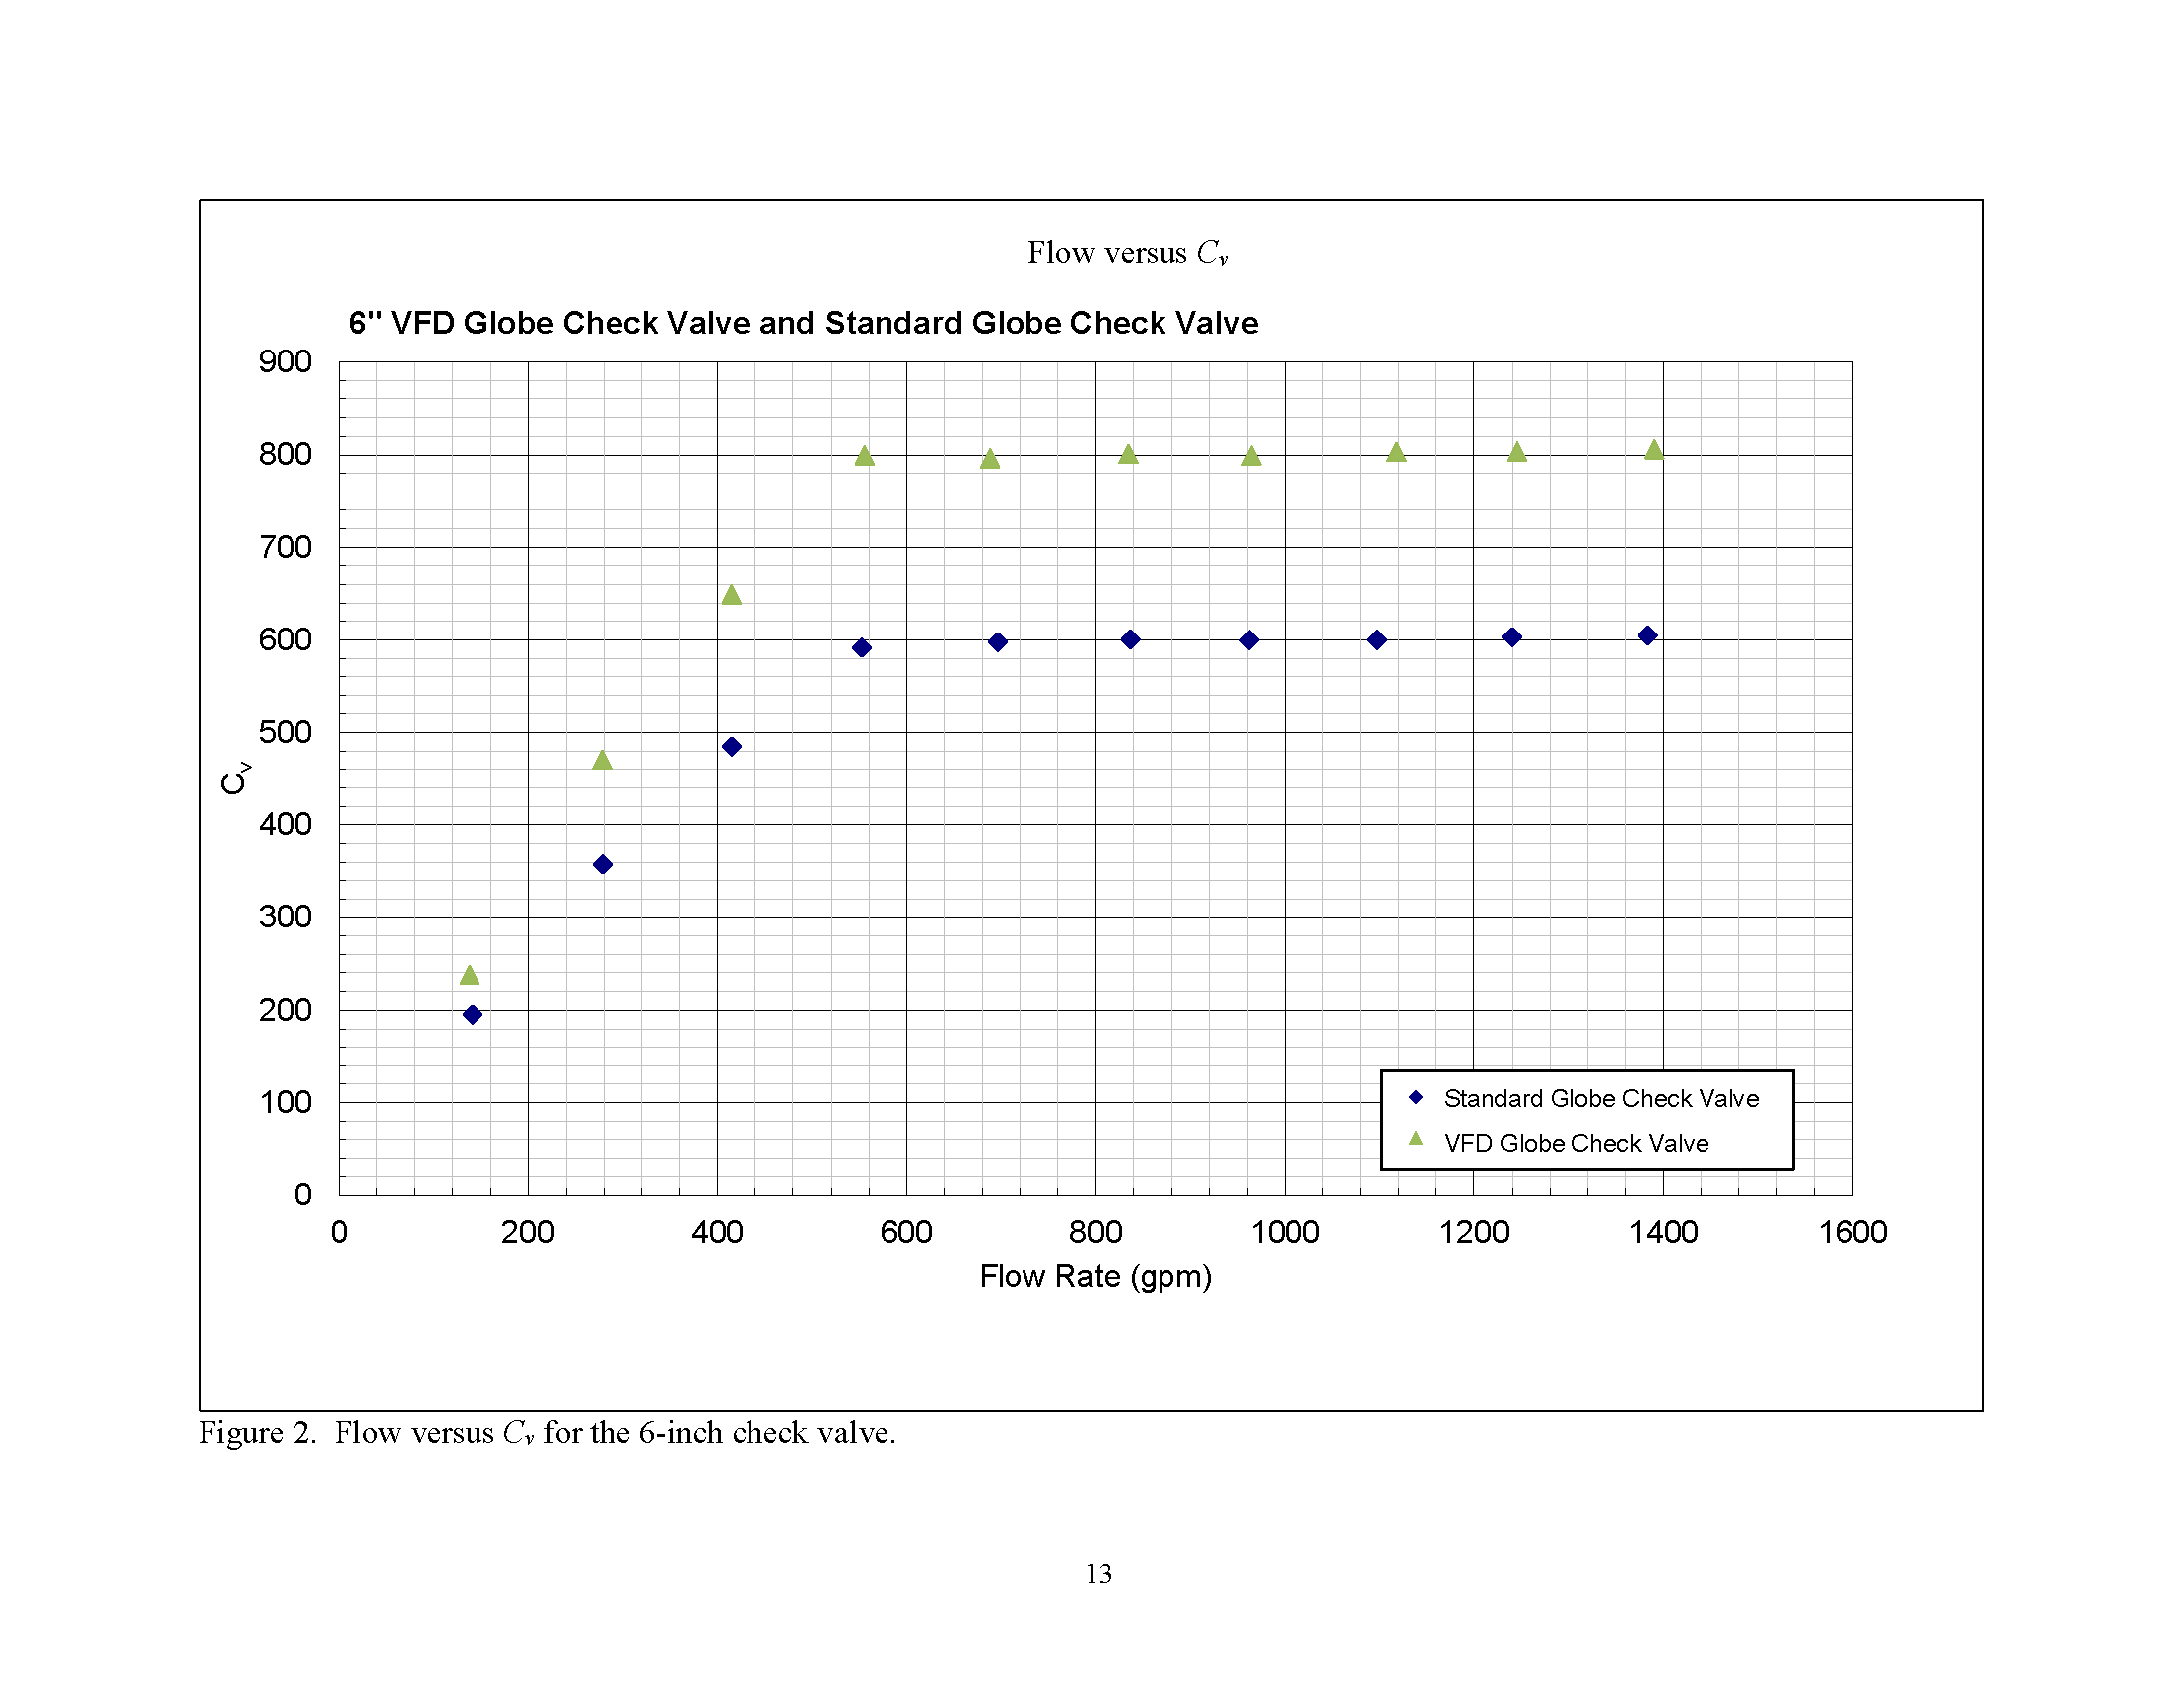
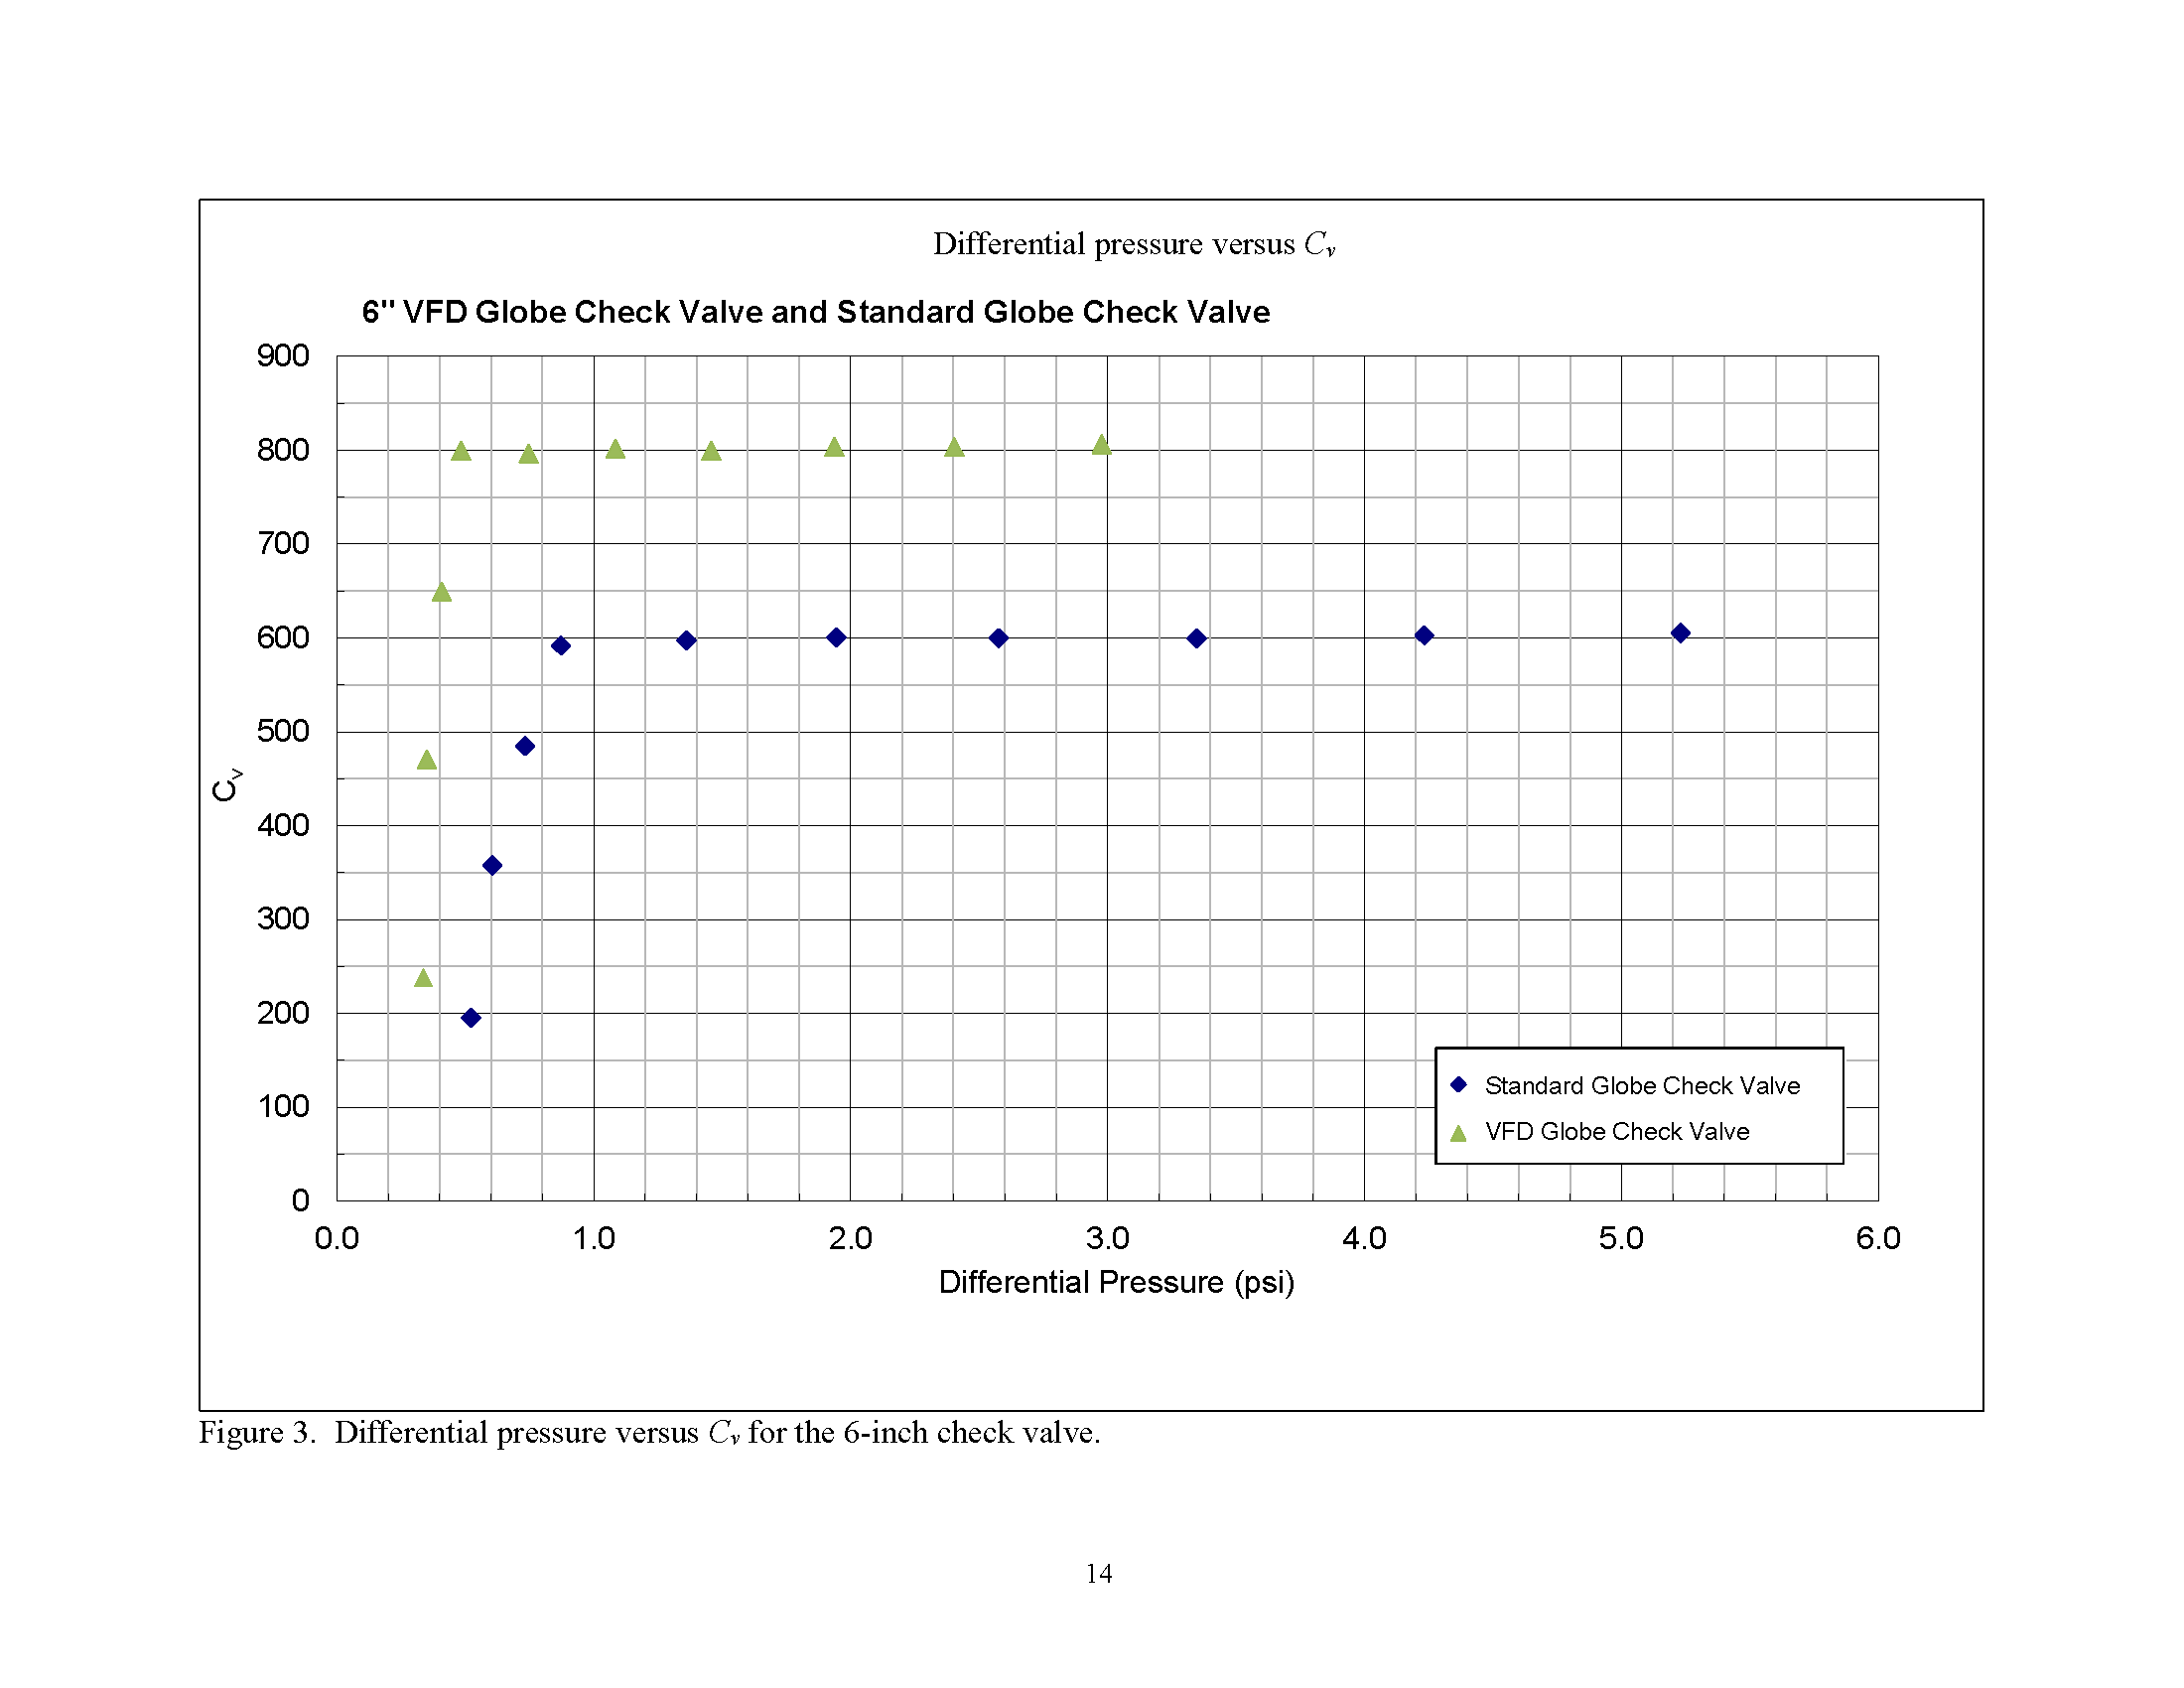
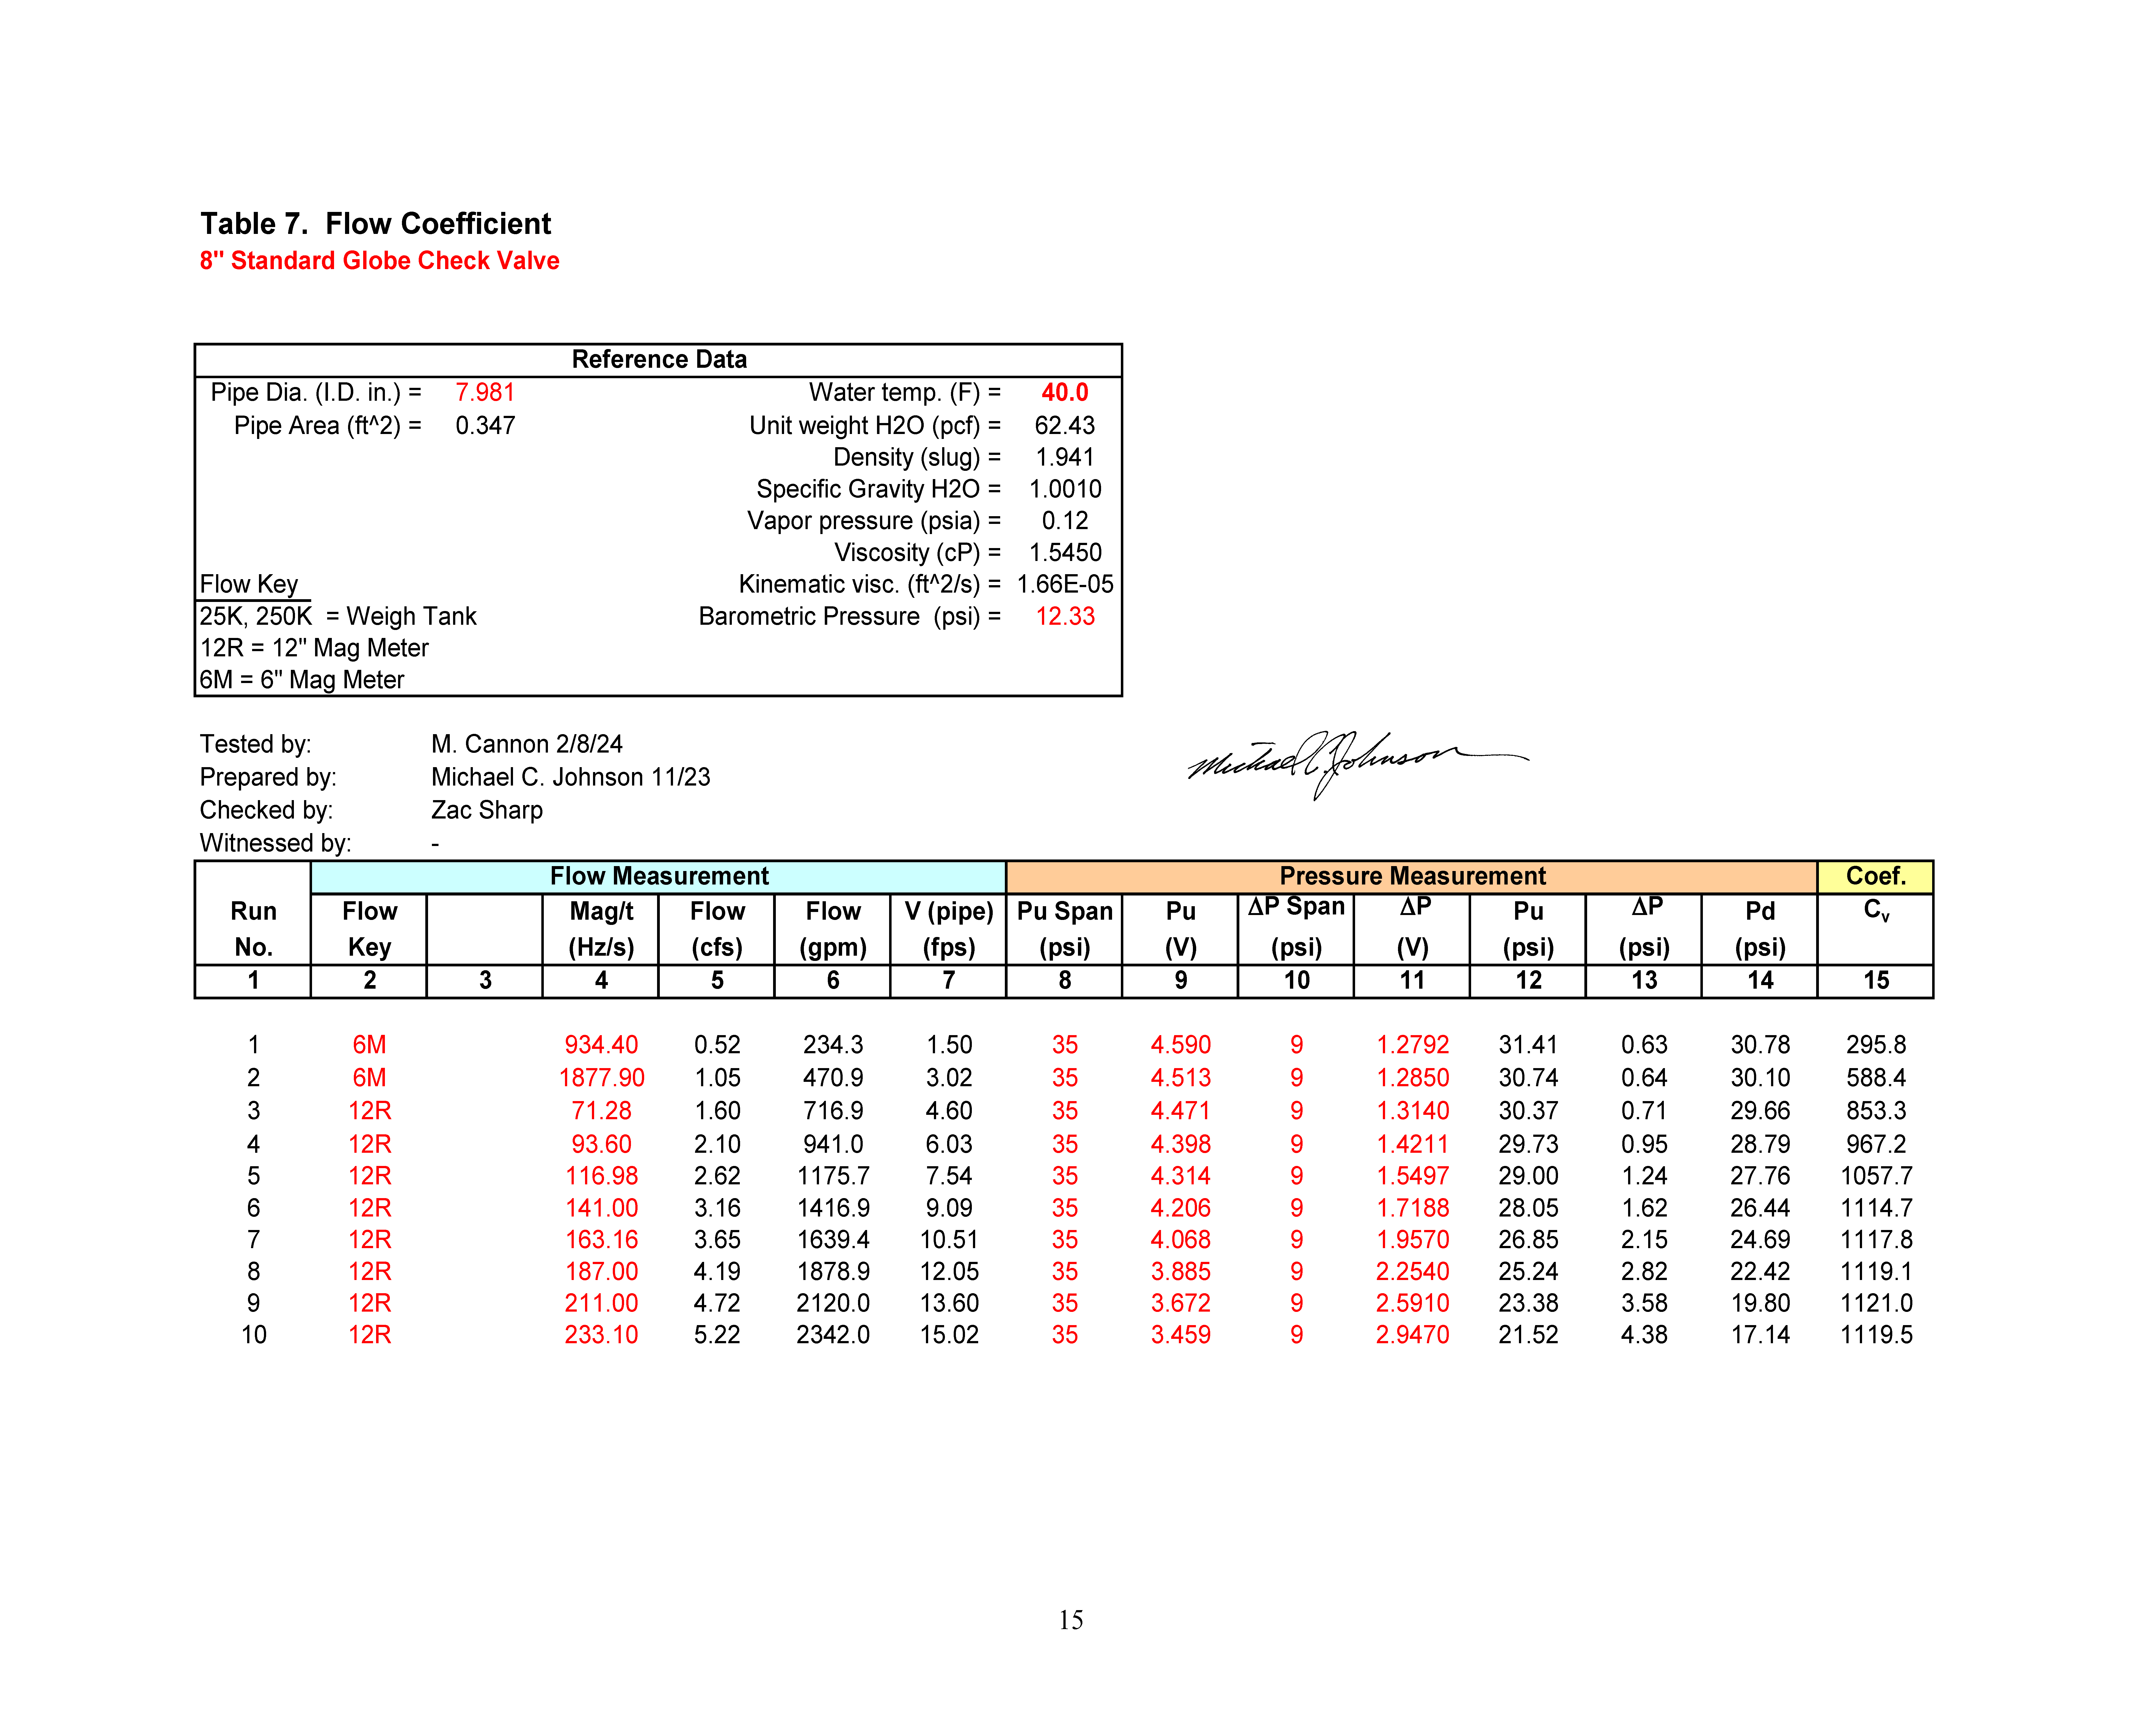
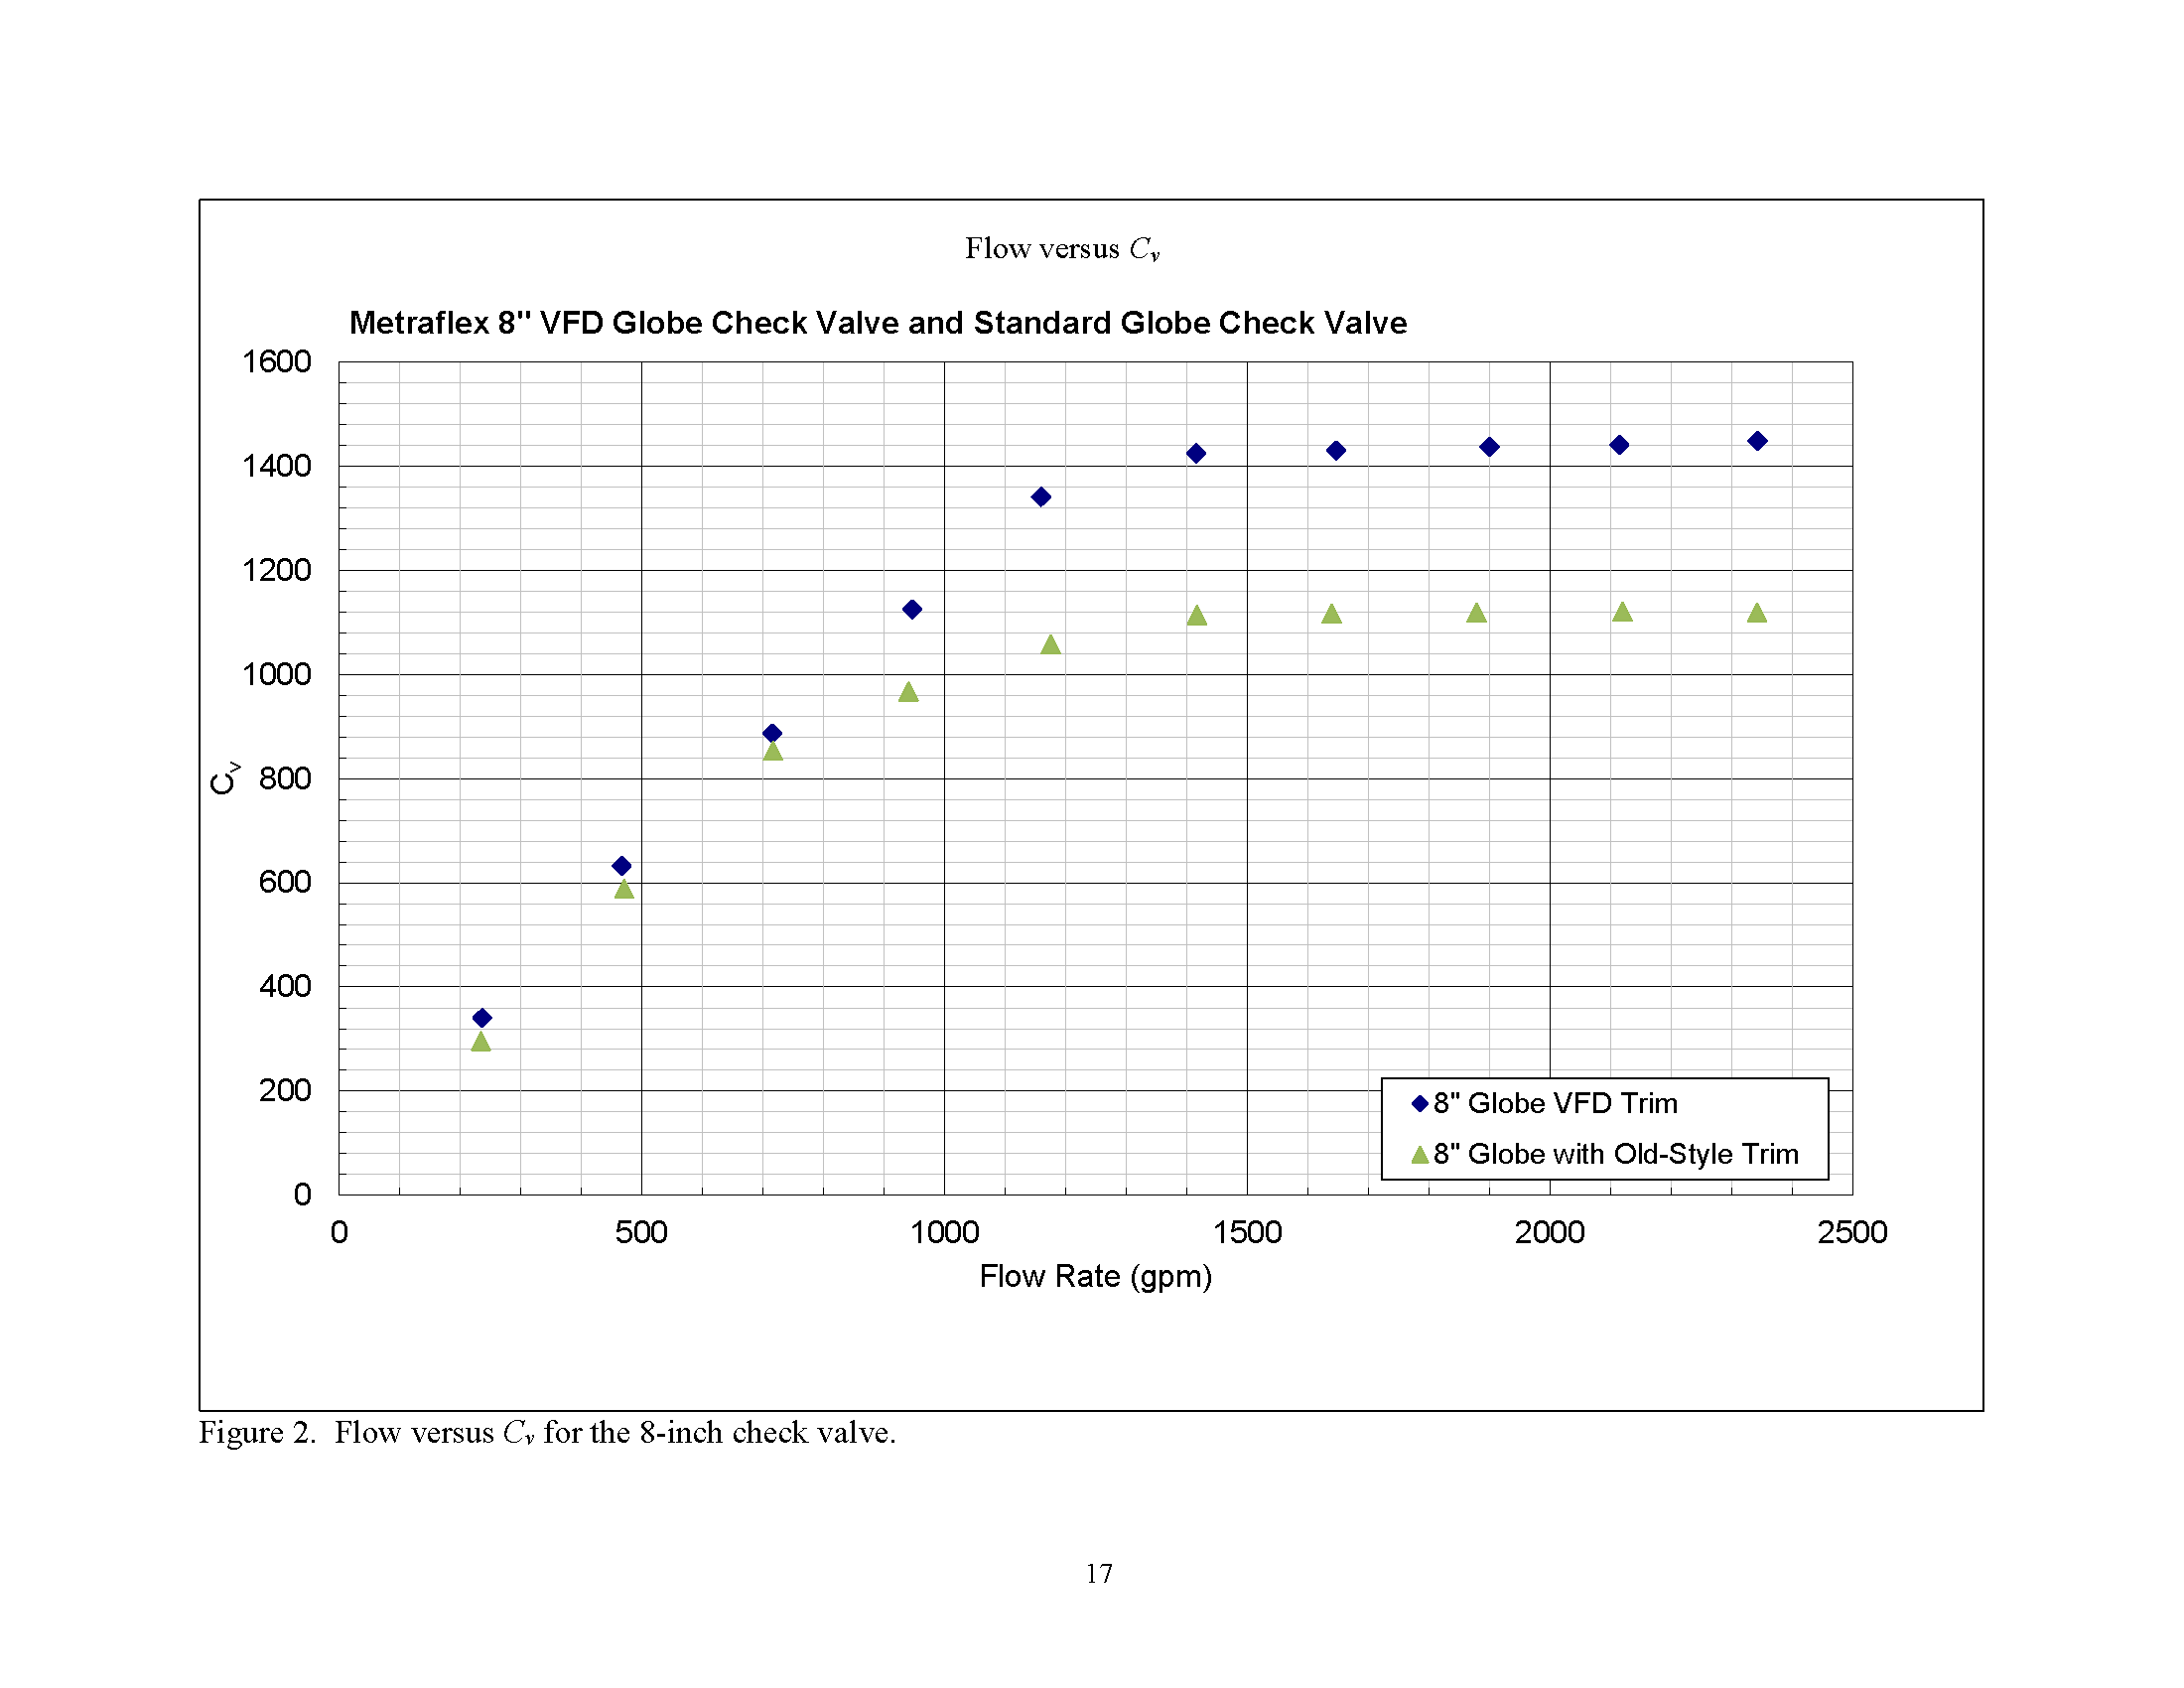
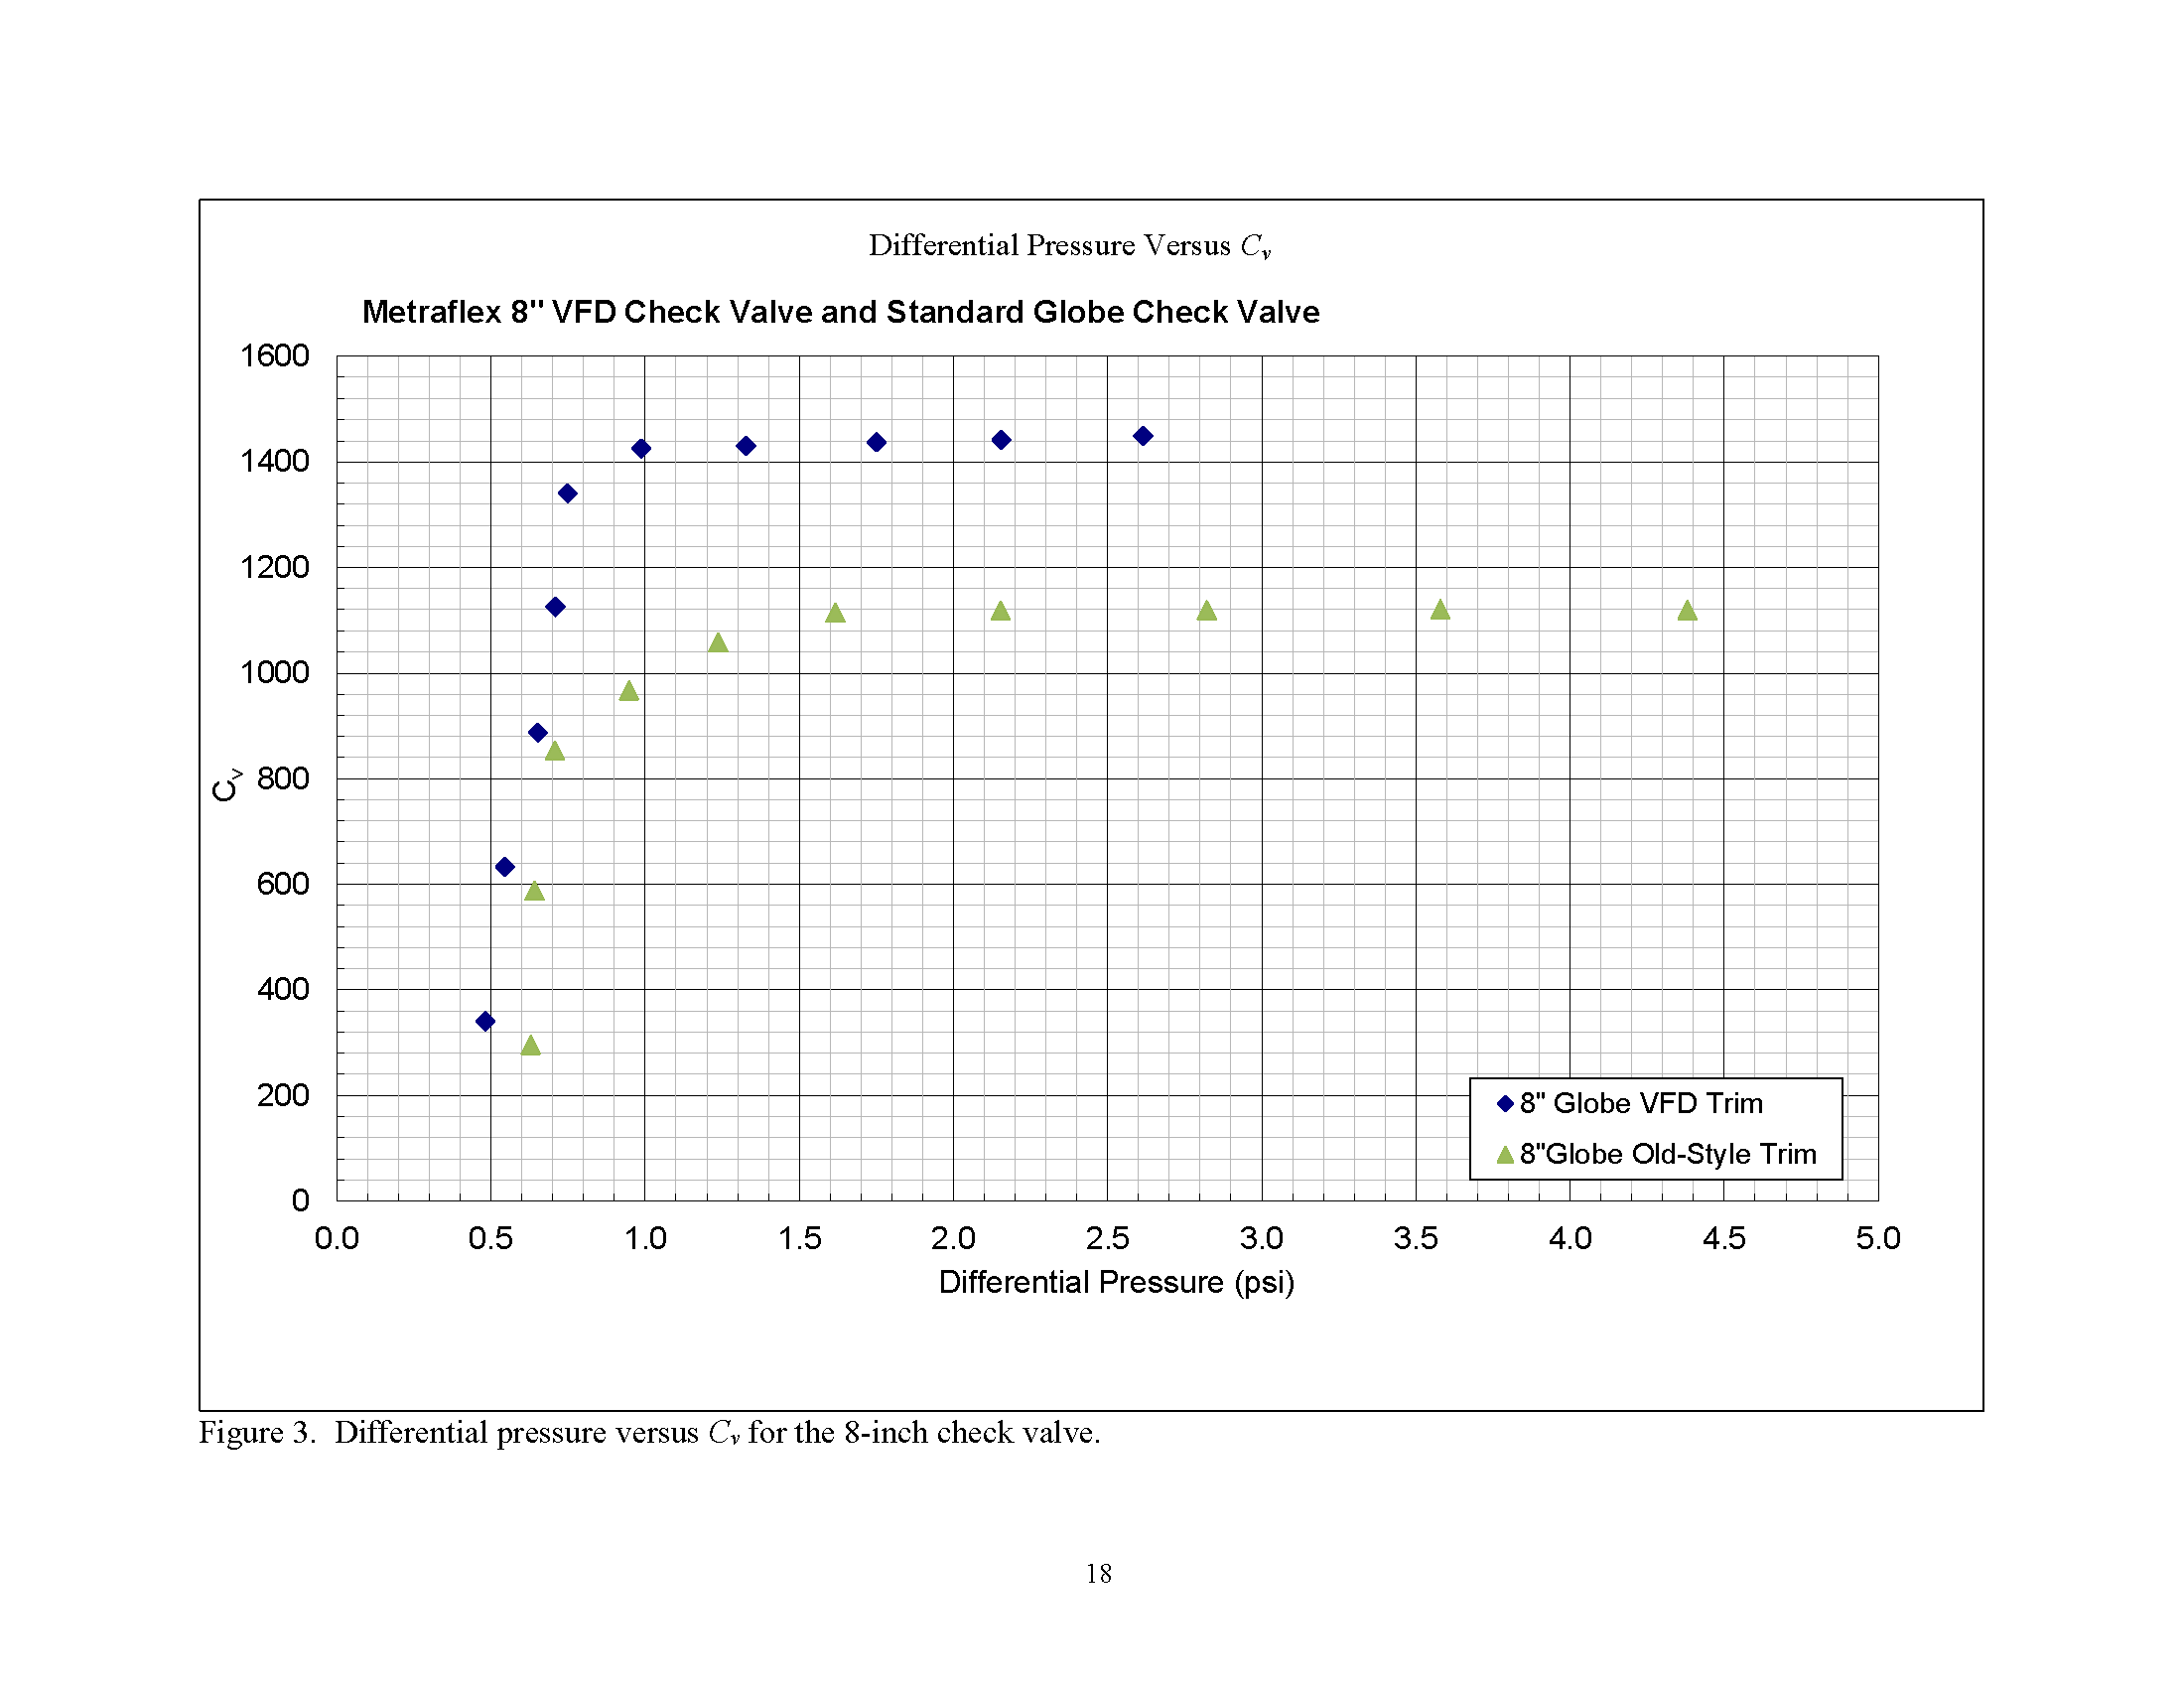
Flow Coefficient performance tests were conducted at the Utah Water Research Laboratory (UWRL) on a 3, 4, 6 & 8-inch standard globe check valves manufactured by Metraflex. The valve was provided with two disc configurations and two springs; the original disc, guide and spring and a new disc, guide and spring (VFD Check Valve). The intent of the testing was to quantify the valve’s discharge capacity for the two different disc configurations over a wide range of flow conditions with the pressure loss and flow measured and flow coefficients determined. The work was authorized by Metraflex with the intent to pay using corporate credit card and was done in accordance with the ANSI/ISA 75.02.01-2008 Control Valve Capacity Test Procedures standard with slight modifications in order to characterize the valve’s performance over a wide flow range.

EXPERIMENTAL PROGRAM

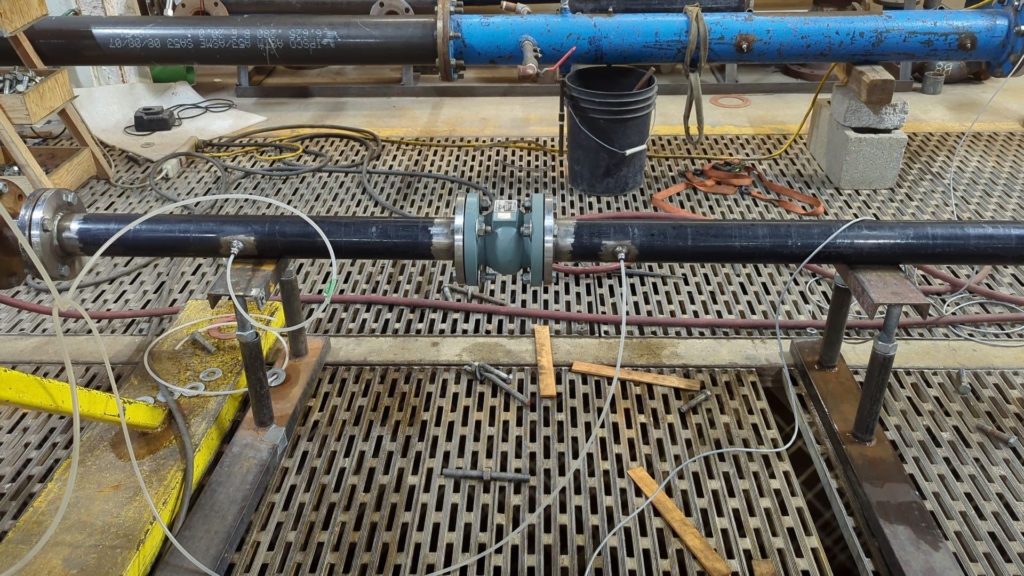
The valve under test was installed in a test line with approximately 20 diameters of straight approach piping to provide uniform flow at the inlet of the valve. There were approximately 10 diameters of straight pipe downstream from the valve. Pressure taps were located two pipe diameters upstream from the valve and six pipe diameters downstream from the valve. Flow was supplied using a 100-horsepower pump. Figure 1 shows the test setup.

Figure 1. 3-inch check valve installed in test line.

The flow rate was measured using magnetic flow meters which were calibrated against certified weigh tanks. The weigh tank was used to verify the flow during testing for each meter. The differential pressure across the valve was measured using a Rosemount differential transmitter. The upstream pressure was measured using a Rosemount pressure transmitter. The water temperature was measured using a calibrated RTD.

FLOW COEFFICIENT

The definition of the flow coefficient used in this report is:

where Q is the discharge of test fluid in U.S. gallons per minute flowing through the valve, ΔP is the pressure drop across the valve in psi, and SG is the specific gravity of the test fluid. Cv in Equation 1 is calculated using the gross pressure drop (ISA standard) between taps that are two diameters upstream and six diameters downstream.

TEST PROCEDURE

The test procedure essentially followed ISA 75.02.01-2008 with slight modifications to account for the fact that the valve is spring loaded and it was desired to determine the valve’s performance characteristics over a wide flow range.

Cv Determinination

  1. Install the check valve in straight piping of nominal size and standard wall thickness. Ensurethat at least 20 diameters of straight pipe are upstream from the valve and at least 8 diametersare installed downstream from the valve.
  2. Flow test the valve at several different flow rates and observe the relationship between flowand Cv.
  3. The following data shall be recorded:
    1. Upstream pressure (measurement not to exceed 2 percent of actual value).
    2. Pressure differential across valve (measurement not to exceed 2 percent of actual value).
    3. Volumetric flow rate (measurement not to exceed 2 percent of actual value).
    4. Fluid temperature (measurement error not to exceed 2 degrees Fahrenheit).
    5. Valve description and identifying numbers.
  4. Calculate the flow coefficient Cv as given in equation 1.


TEST RESULTS

The flow coefficient Cv for the valve is given in Tables 1 and 2 and plotted graphically on Figure 2. Figure 3 shows Cv plotted against pressure drop for the valve.


Rep icon Your Local Rep